The yield curve says "no recession"
Because of the way the Fed conducts monetary policy, the Treasury yield curve can tell us a lot about the market's expectations for economic growth and inflation. Currently, the yield curve is saying that the market expects to see modest economic growth of 1 - 2% for the foreseeable future, with modest inflation as well, in the range of 1.3 – 1.6% per year over the next five to ten years.
Central banks have only three choices when it comes to policy tools. They can either control the money supply, interest rates (short or long, but not both), or the exchange rate, and only one of those at a time. After choosing one, they must accept the market's verdict on the others. Any attempt to control more than one of these monetary variables will inevitably end in tears, as the central banks of Argentina and many other developing economies can attest.
The Fed long ago decided that it would conduct monetary policy by controlling overnight interest rates (i.e., Fed funds). For many years the FOMC would add or subtract reserves from the banking system in order to keep the Fed funds rate (the rates banks charge each other to borrow reserves) at or near the Fed's target.
Beginning in late 2008, the Fed modified this strategy, since it purposefully supplied trillions of excess reserves to the banking system. With a super-abundance of reserves, banks essentially have no need to borrow more, so the traditional Fed funds market no longer exists. The Fed solved that "problem" by deciding to pay interest on excess reserves (IOER), and that rate became the de facto Fed funds rate, enforced recently by allowing non-bank institutions to enter into reverse-repo transactions with the Fed and thus effectively earn the same rate that major banks can by holding excess reserves at the Fed.
The evidence to date is still relatively scant, but it looks like things are proceeding according to the Fed's plan. Libor, the rate that the market demands for lending to banks instead of to the Fed, is trading around 60 bps, which is somewhat higher than the 50 bps that banks earn by lending money to the Fed (i.e., by holding excess reserves at the Fed), and that makes sense. In other words, the Fed appears to have found a way to target the overnight risk-free rate by simply changing the rate it pays on excess reserves. The Fed's primary tool—short-term interest rates—hasn't changed, but the method of implementing it has.
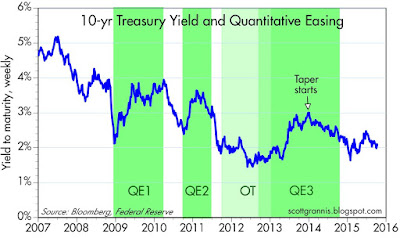
Regardless, it is important to remember that the Fed can only control short-term rates. As three Quantitative Easing episodes from 2008 through 2014 demonstrated, despite the Fed's massive purchases of notes and bonds, 10-yr Treasury yields actually rose (see chart above). This put the lie to the Fed's professed objective of buying notes in order to artificially lower yields and thus "stimulate" the economy. As I've explained many times over the years, the real purpose of QE was NOT to lower bond yields and stimulate the economy—the real purpose was to supply the world with more risk-free monetary assets (aka bank reserves, which, with the addition of IOER, became T-bill substitutes) in order to satisfy the world's intense demand for money and safe assets in the wake of the 2008 financial crisis. The Fed did this by buying notes and bonds and "transmogrifying" them into T-bill equivalents. This was neither stimulative nor inflationary, since the Fed was simply supplying the money that the market wanted to hold.
Since the Fed can only control short-term rates, observing longer-term rates can tell us a lot about the market's expectations for the future of Fed policy. 2-yr Treasury yields, for example, are equivalent to the market's guess as to what the Fed funds rate will average over the next two years. The current 2-yr yield of 0.8% is a function of the market's expectation that the Fed funds rate will rise from 0.5% today to 1% or so two years from now. This expected path of the funds rate is consistent with a forecast of modest economic growth and low inflation. It is not consistent with an expectation of recession.
Market equilibrium tells us that, collectively, investors at any moment in time must be indifferent between earning the prevailing overnight risk-free interest rate for two years or investing their money in a 2-yr risk-free security and holding it for two years. Ditto for 5-year yields. But when it comes to 10-yr yields, the analysis becomes trickier, since the market invariably demands some kind of premium for locking in yields for such a long period. Nevertheless, looking at the difference between 2-yr and 10-yr Treasury yields can tell us a lot about what the market expects from the Fed over the next several years.
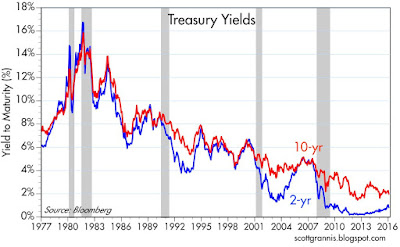
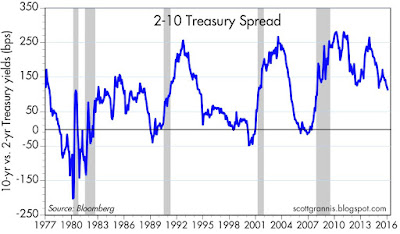
The two charts above show the history of 2- and 10-yr Treasury yields and the difference between the two, which is the slope of the yield curve. Note that the slope of the yield curve typically flattens or inverts (becomes negative) in advance of recessions. This is the bond market's way of saying that emerging weakness in the economy is putting a lid on the Fed's ability to raise short-term rates, and that it is increasingly likely that the Fed's next move will be to cut, rather than raise, rates. The current slope of the yield curve is not unusual at all, and is typical of the middle part of a business expansion. The market doesn't believe the economy is going to be weak enough to warrant lower short-term rates for the foreseeable future.
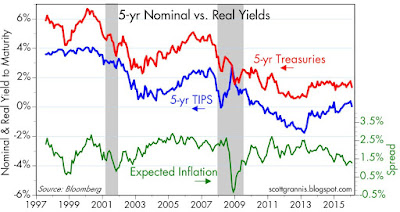
The chart above compares the nominal yield on 5-yr Treasuries with the real yield on 5-yr TIPS, the difference between the two being the market's expected annualized rate of inflation over the next 5 years, currently 1.3%. This is relatively low, but not unprecedented and not of great concern. Indeed, I would be thrilled if inflation were to average 1.3% per year for the foreseeable future. Inflation is pernicious, penalizing savers and rewarding borrowers, and is effectively a backdoor way for the government to avoid the full consequences of its spendthrift ways. The lower the better, in my book.
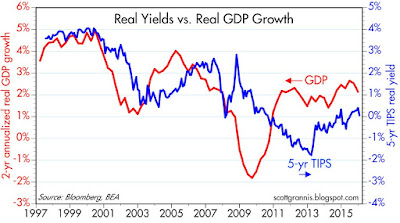
The chart above compares the real yield on 5-yr TIPS with the 2-yr annualized rate of real GDP growth. These rates tend to track each other, with real yields on TIPS tending to be a point or so less than the economy's growth tendency over the past two years. That makes sense: you can lock in a risk-free rate of return on TIPS, or you can take your chances with the real growth of the economy. Risk-free yields should always be less than riskier returns. As I read this chart, the market is expecting real GDP growth to be between 1 and 2% for the next few years, which is a bit less than the 2.1% annualized growth of the economy in the current business cycle expansion.
There's not much to get excited or worried about here. The market is (not atypically) projecting that recent trends in growth and inflation will persist for the foreseeable future.
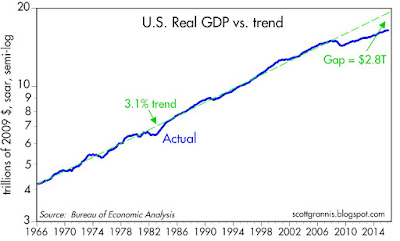
Meanwhile, as the chart above suggests, this continues to be the weakest post-war recovery on record. If this had instead been a "normal" recovery, the economy today would be about 15% ($2.8 trillion!) bigger. Rather than worrying about a recession, we should be obsessed with finding ways to get the economy back on its long-term growth path. (Hint: smaller government, reduced regulatory burdens, lower and flatter marginal income tax rates, and much lower corporate tax rates.)
It's the unrealized growth potential of the economy that is the big news, not the risk of recession.
This post was originally published at Calafia Beach Pundit
Copyright © Scott Grannis
About Scott Grannis
Scott Grannis was Chief Economist from 1979-2007 at Western Asset Management, a Pasadena-based, global manager of fixed-income portfolios for institutional clients. He now enjoys keeping up on economics, markets, and politics from my condo overlooking Calafia Beach on the Southern California coast, where he'd like to think that he's immune to Wall Street groupthink. Married for 43 years to his wonderful Argentine wife Norma, with their four children and five grandchildren (four boys and one girl). He's a believer in supply-side economic theory, as practiced by my mentors, the late Jude Wanniski, Art Laffer, and Larry Kudlow. John Rutledge is another of his mentors, from the days they worked together at Claremont Economics Institute.


