
SIA Weekly: Relative Strength Continues to Favour US Equities over Canadian
For this week’s SIA Equity Leaders Weekly, we are going to relook at the U.S. Equity market as it looks to challenge prior highs on the S&P 500 Composite Index. Also, looking at the main Canadian equity index in the TSX Composite will give us more information on this outlook going forward. As each index is near a major support or resistance level, this could lead to temporary pull-backs or reversals, but the long-term relative strength is still in Favor of U.S. Equity over Canadian Equity at this time.
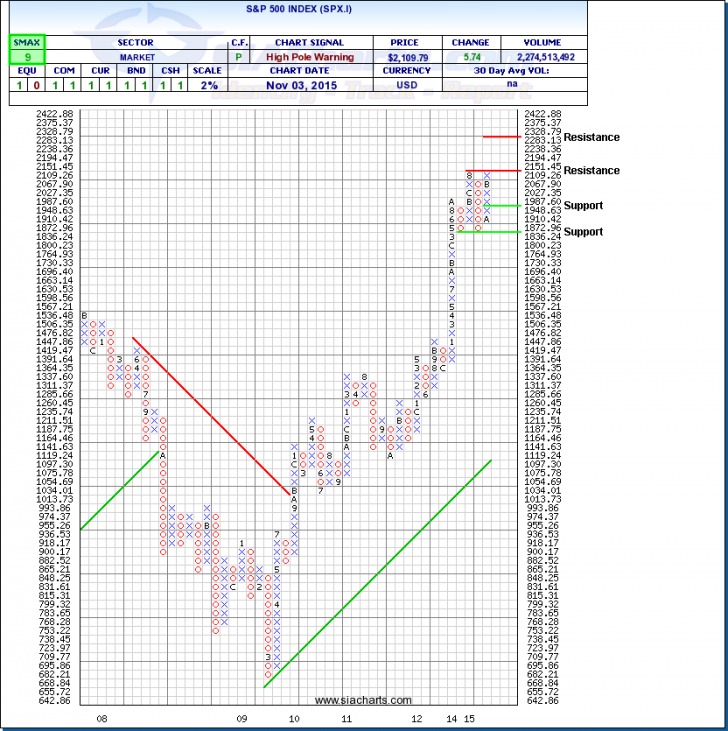
S&P 500 Index (SPX.I)
Since we last looked at this S&P 500 Index (SPX.I) point and figure chart, it was holding at the support level at 1836.24 at the end of August in 2015 and also from August of the prior year. It has been range bound for the last 2 years between this level and the resistance level which it has now up against at 2151.45. This will be a key level to watch because it may help us understand the future direction of U.S. Equity if it can break through to new highs into a double top point chart pattern at 2%. Until then, minor support can be found at the 1948.63 level and further resistance is found above at 2328.13.
With U.S. Equity one of the top asset classes in the SIA long-term relative strength ranking, it has had a nice one-month move, but is still basically flat over the last 3 months (+0.56%) and last 6 months (+0.07%). The SPX.I will be an important chart to monitor to see if it breaks through to new highs or once again hits resistance like before leading to a short-term pullback and reversal. With an SMAX score of 9 out of 10, the SPX.I is showing near-term strength against all other asset classes, but again, keep in mind the trading range it has been in over the last 2 years and key resistance level at 2151.
Click on Image to Enlarge
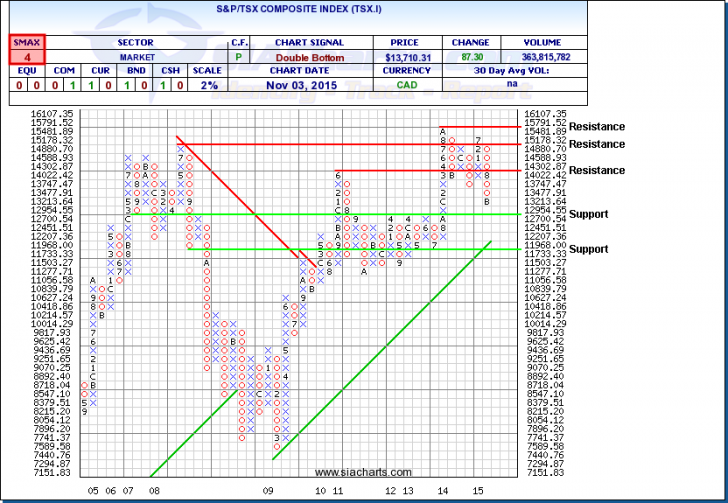
S&P/TSX Composite Index (TSX.I)
Unlike the U.S. Equity index we looked at above, the Canadian S&P/TSX Composite Index (TSX.I) is not looking to challenge its prior highs and is headed in the other direction with multi-year lows seen at the end of September around the 13000 level. If the weakness continues, a major support level is seen at 12,700 level which would expect to hold based on its history. Below that is further support at 11,733.33 level which also sees the upwards trend line come into play as other support. To the upside should the TSX.I reverse off into a column of X's (which is expected at some point based on the strong support below even in a downward trend), resistance is found at the 2011 high at 14,302.87 and beyond this at the 2008 high at 15,178.32.
With an SMAX score of 4 out of 10, the TSX.I is showing some near-term weakness against the other asset classes and especially against equities, like U.S. Equity. Unlike the U.S. Equity benchmark above that has been relatively flat over the last 3 and 6 month time periods, the TSX.I has seen losses of -5.24% over 3 months and -10.62% over the last 6 months as a result of continued weakness in the Energy (XEG.TO down -19.24% over 6 last months) and Metals & Mining (XMA.TO down -23.26% over last 6 months) sectors mainly. Relative Strength within the Canadian market versus the main index is still being found in the Consumer Staples (XST.TO up 8.94% over last 6 months) and Technology (XIT.TO down 1.9% over last 6 months).
For a more in-depth analysis on the relative strength of the equity markets, bonds, commodities, currencies, etc. or for more information on SIACharts.com, you can contact our customer support at 1-877-668-1332 or siateam@siacharts.com.
Click on Image to Enlarge
SIACharts.com specifically represents that it does not give investment advice or advocate the purchase or sale of any security or investment. None of the information contained in this website or document constitutes an offer to sell or the solicitation of an offer to buy any security or other investment or an offer to provide investment services of any kind. Neither SIACharts.com (FundCharts Inc.) nor its third party content providers shall be liable for any errors, inaccuracies or delays in content, or for any actions taken in reliance thereon.