Ryan Lewenza: Technically Speaking (October 23, 2015)
Summary
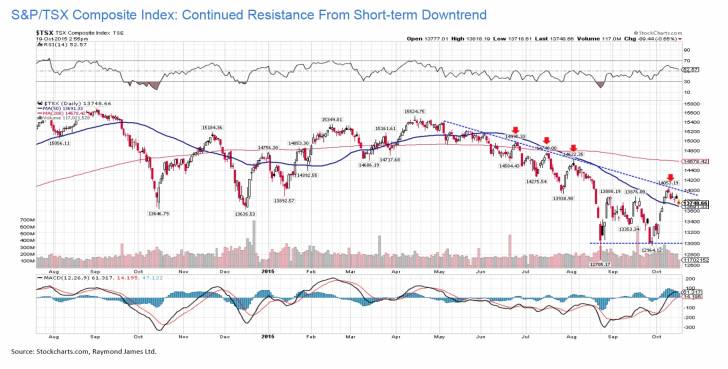
• Having rallied over 1,000 points since late September, the S&P/TSX Composite Index (S&P/TSX) is finding resistance at the short-term downtrend around the 14,000 level. We continue to expect strength into year-end, but see 14,000 as the key technical level. A break above this level would help validate our year-end rally call.
• The S&P 500 Index (S&P 500) has rallied sharply following a classic double bottom formation. Having broken above the top of this formation, the measuring implications of this pattern is 120 points, or 2,110.
• Market breadth had been in a steady decline since the spring. While there are a number of breadth indicators we look at, we tend to focus on the NYSE Advance/Decline Line and the Percentage of Stocks in the S&P 500 trading above their 50-day MAs. Both of these indicators recently broke out, which signals broadening market participation, a bullish sign for the equity markets.
• The recent deceleration of US economic momentum has led to reduced expectations of a US Fed rate hike. As a result, the US dollar has been weaker of late with the US Dollar Index trading below its 50- and 200-day MAs. The US Dollar Index is trading near key technical support around 93. A break below this level would have significant implications for commodities, and in turn equity markets/sector performance.
• As a result of the US dollar weakness, the technical profile for gold has significantly improved in recent weeks.
• With commodities being priced in US dollars, a weaker US dollar is typically bullish for commodities. The recent gains off the August lows for the CRB Commodity Index can in part be attributed to the US dollar weakness. Further US dollar weakness would be bullish for the commodity complex.
• With an oversold condition for the energy sector and US dollar weakness, the Canadian energy sector has experienced a decent bounce in recent weeks. As a result, the energy sector has broken above its relative downtrend versus the broader equity market. This is a positive first step in the energy sector’s turnaround.
• The S&P/TSX Health Care Index has been in a very strong uptrend for years. As a result, it has consistently outperformed the overall equity market. However, with the recent sell off in Valeant Pharmaceuticals International (VRX-T) and Concordia Healthcare Corp (CXR-T), the sector’s relative strength has deteriorated. In the short-term the sector is very oversold and could soon see a trading bounce. Following an expected bounce, if the sector then makes a new relative low, investors should consider reducing exposure to this sector.
Read/Download the complete report below:
Technically Speaking - October 21, 2015
Copyright © Raymond James