by Don Vialoux, EquityClock.com
Pre-opening Comments for Friday October 31st
U.S. equity index futures were higher this morning. S&P 500 futures were up 22 points after the Bank of Japan announced a surprise economic stimulus program that included equity purchases. The Nikkei Average jumped 5.1%. Dow Jones Average futures were up over 200 points. An open at this level will place the Average at an all-time high.
Index futures were virtually unchanged following release of economic news at 8:30 AM EDT. Consensus for September Personal Income was a gain of 0.3% versus a increase of 0.3% in August. Actual was a gain of 0.2%. Consensus for September Consumer Spending was a gain of 0.1% versus an increase of 0.5% in August. Actual was a decline of 0.2%.
The Canadian Dollar drifted below US 89 cents following release of the Canadian August GDP report. Consensus for growth on a year over year basis was growth at a 2.3% rate versus growth at a 2.5% rate in July. Actual was growth at a 2.2% rate. On a month over month basis, August GDP was expected to be unchanged from July. Actual was a decline of 0.1%.
Third quarter reports continue to flood in. Companies that reported after the close yesterday included Abbvie, Chevron, ExxonMobil, Hilton Legg Mason, Linkedin and Starbucks.
Avon slipped $0.03 to $9.94 after B. Riley and Stifel Nicolaus downgraded the stock.
EquityClock.com’s Daily Market Comment
Following is a link:
http://www.equityclock.com/2014/10/30/stock-market-outlook-for-october-31-2014/
MarketWatch Comment
Headline reads, “A Halloween treat for the stock market”. Following is a link:
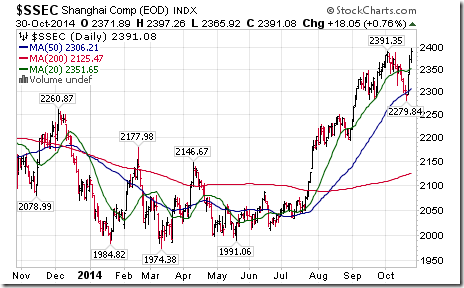
Interesting Chart
The Shanghai Composite Index is the first broadly based equity index to break to a new recent high.
StockTwits Released Yesterday
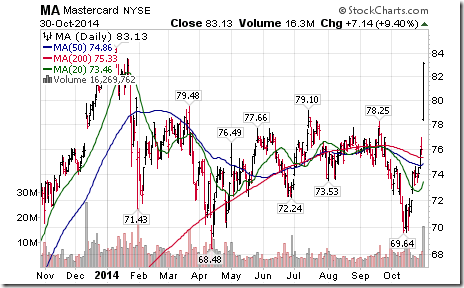
Quiet bullish technical by S&P 500 stocks to 10:30. 5 stocks broke resistance: $CAG, $LM, $PRGO, $MA, $CI.
Nice breakout above $79.10 by $MA to an 8 month high. An encouraging sign for the Christmas buying season!
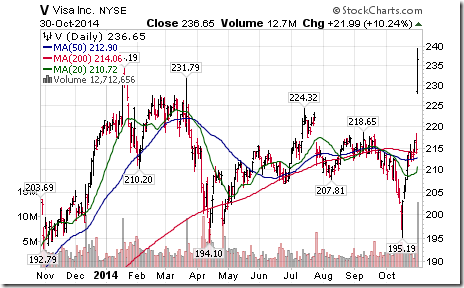
DJIA up 85. S&P down 2. Reason: heavy weight $V in the DJIA.
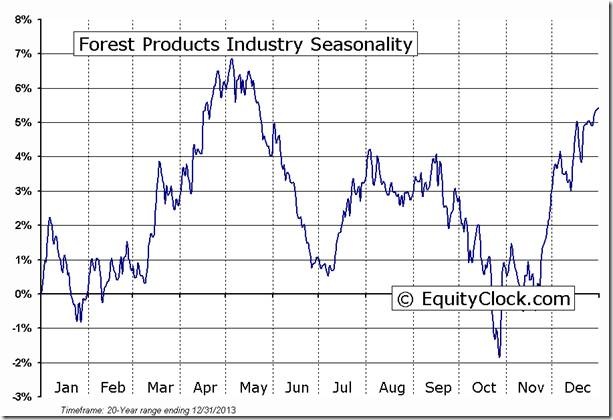
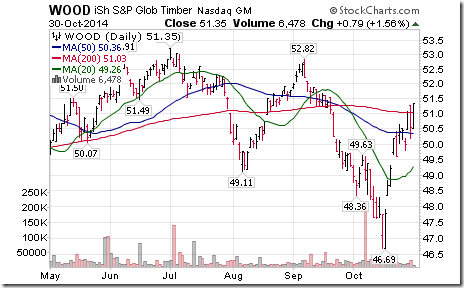
Forest product stocks are upside leaders: $IP, $MWV, $WFT.CA, $CFP.CA. ‘Tis the season for forest product stocks!
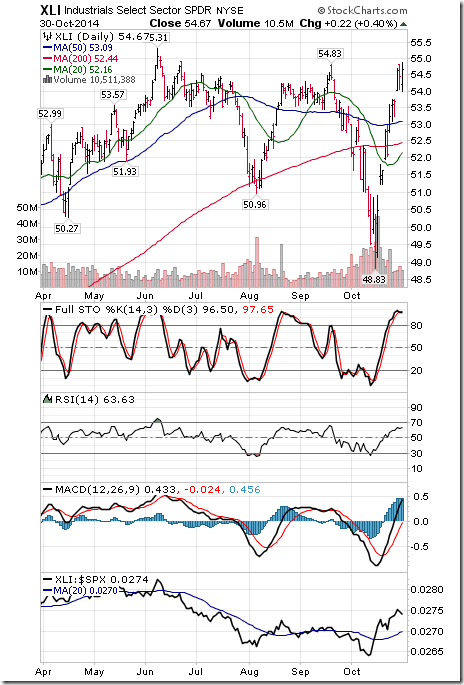
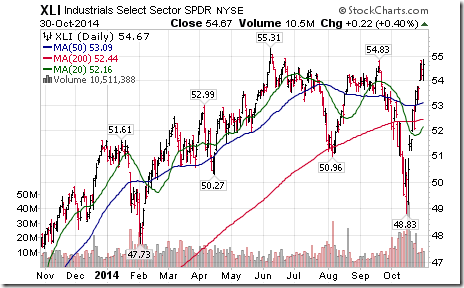
$XLI broke above $54.83 to reach a 5 month high. ‘Tis the season for strength in the Industrial Sector!
Technical Action by Individual Equities
By the close yesterday, 17 S&P 500 stocks broke resistance and none broke support.
Among TSX 60 stocks, First Quantum Minerals and Silver Wheaton broke support.
Monitored List of Technical/Seasonal Ideas
Green: Increased score
Red: Decreased score
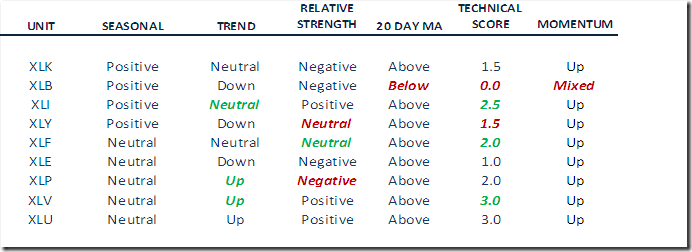
Summary of Weekly Seasonal/Technical Parameters for SPDRs
Key:
Seasonal: Positive, Negative or Neutral on a relative basis applying EquityClock.com charts
Trend: Up, Down or Neutral
Strength relative to the S&P 500 Index: Positive, Negative or Neutral
Momentum based on an average of Stochastics, RSI and MACD: Up, Down or Mixed
Twenty Day Moving Average: Above, Below
Red: Downgrade
Green: Upgrade
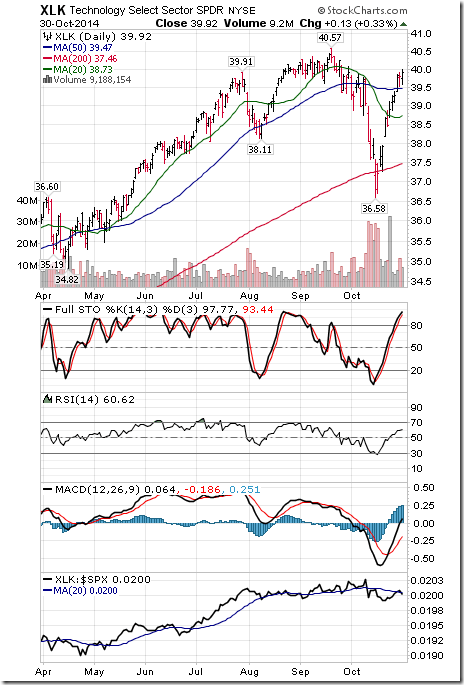
Technology
· Intermediate trend remains neutral
· Units remain above their 20 day moving average
· Strength relative to the S&P 500 Index remains negative
· Technical score remains at 1.5 out of 3.0.
· Short term momentum indicators are trending up, but are overbought.
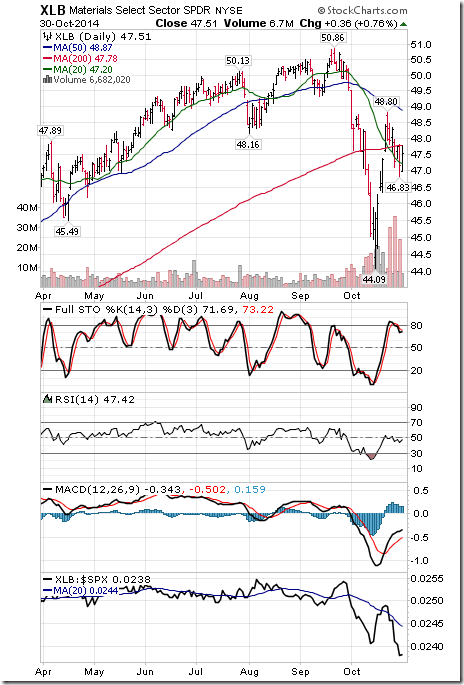
Materials
· Intermediate trend remains down.
· Units fell below their 20 day moving average
· Strength relative to the S&P 500 Index remains negative
· Technical score fell to 0.0 from 1.0 out of 3.0
· Short term momentum indicators are mixed
Industrials
· Intermediate trend changed to neutral from down.
· Units remained above their 20 day moving average
· Strength relative to the S&P 500 Index remains positive
· Technical score improved to 2.5 from 2.0 out of3.0
· Short term momentum indicators are trending up, but are overbought.
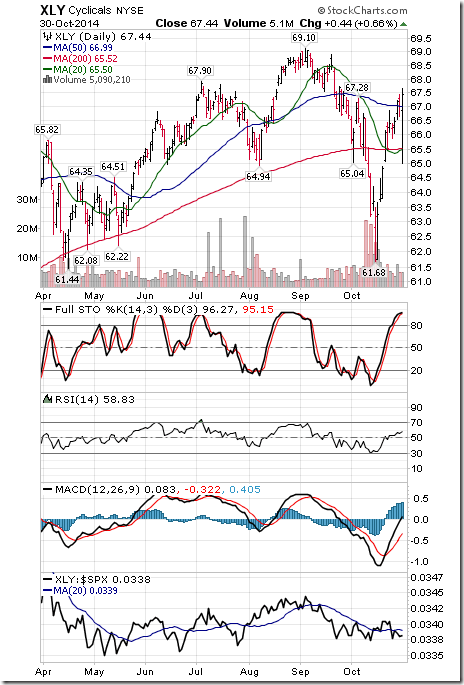
Consumer Discretionary
· Intermediate trend remains down.
· Units remain above their 20 day moving average
· Strength relative to the S&P 500 Index changed to neutral from positive
· Technical score slipped to 1.5 from 2.0 out of 3.0
· Short term momentum indicators are trending up, but are overbought.
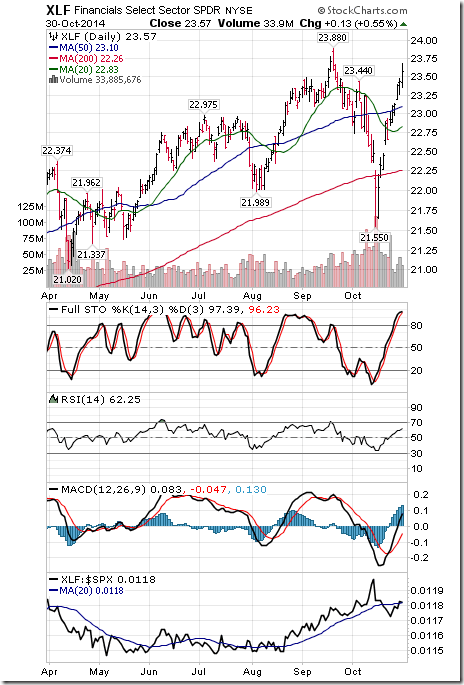
Financials
· Intermediate trend remains neutral
· Units remain above their 20 day moving average
· Strength relative to the S&P 500 Index changed to neutral from negative
· Technical score improved to 2.0 from 1.5 out of 3.0
· Short term momentum indicators continue to trend up.
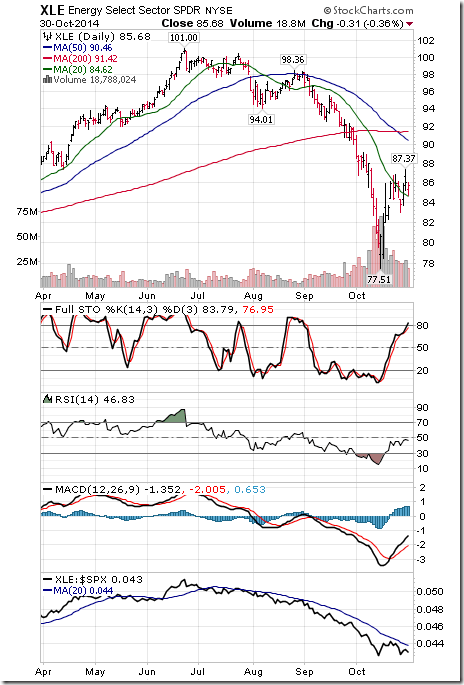
Energy
· Intermediate trend remains down.
· Units remain above their 20 day moving average
· Strength relative to the S&P 500 Index remains negative
· Technical score remains at 1.0 out of 3.0
· Short term momentum indicators are trending up.
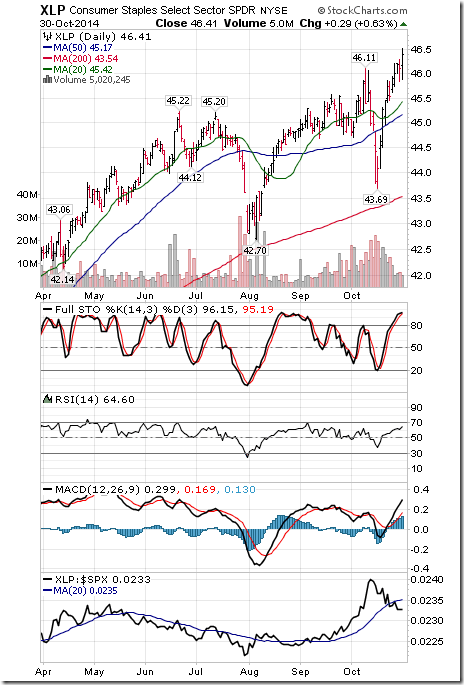
Consumer Staples
· Intermediate trend changed to up from neutral on a move above $46.11
· Units remain above their 20 day moving average
· Strength relative to the S&P 500 Index changed to negative from neutral
· Technical score remains at 2.0 out of 3.0
· Short term momentum indicators are trending up, but are overbought.
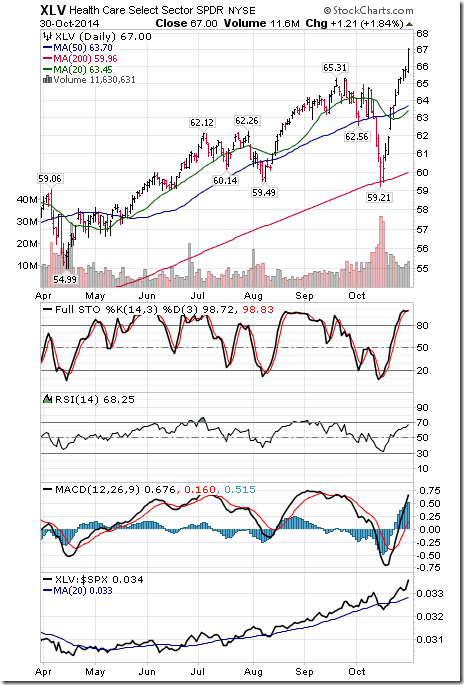
Health Care
· Intermediate trend changed to up from neutral on a move above $65.31
· Units remain above their 20 day moving average
· Strength relative to the S&P 500 Index remains positive.
· Technical score improved to 3.0 from 2.5 out of 3.0
· Short term momentum indicators are trending up, but are overbought.
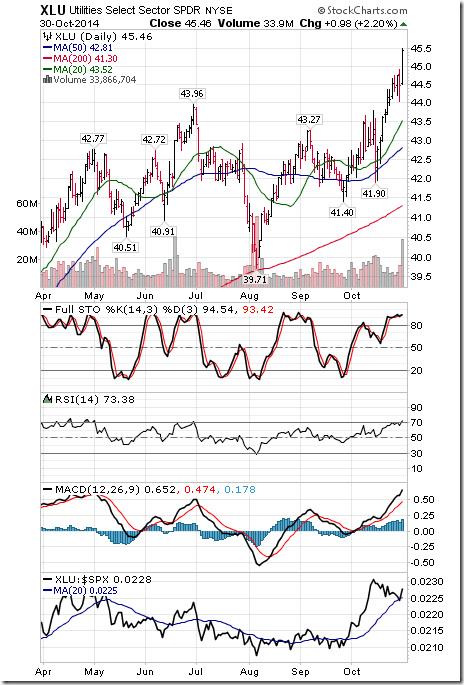
Utilities
· Intermediate trend remains up
· Units remain above their 20 day moving average
· Strength relative to the S&P 500 Index remains positive
· Technical score remains at 3.0 out of 3.0
· Short term momentum indicators are trending up, but are overbought.
Special Free Services available through www.equityclock.com
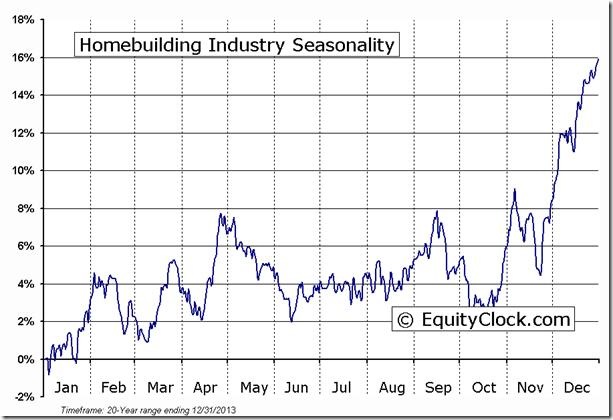
Equityclock.com is offering free access to a data base showing seasonal studies on individual stocks and sectors. The data base holds seasonality studies on over 1000 big and moderate cap securities and indices. To login, simply go to http://www.equityclock.com/charts/
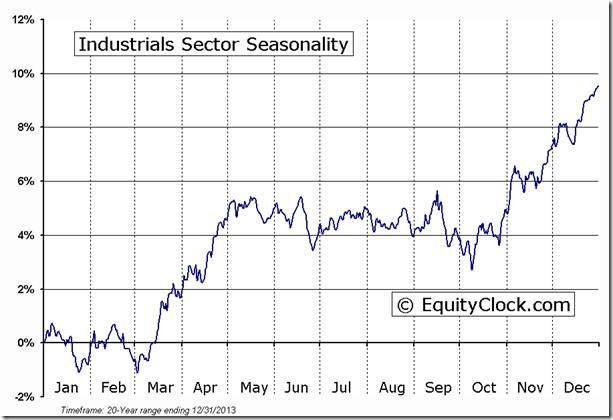
Following is an example:
Disclaimer: Comments, charts and opinions offered in this report by www.timingthemarket.ca and www.equityclock.com are for information only. They should not be considered as advice to purchase or to sell mentioned securities. Data offered in this report is believed to be accurate, but is not guaranteed. Don and Jon Vialoux are Research Analysts with Horizons ETFs Management (Canada) Inc. All of the views expressed herein are the personal views of the authors and are not necessarily the views of Horizons ETFs Management (Canada) Inc., although any of the recommendations found herein may be reflected in positions or transactions in the various client portfolios managed by Horizons ETFs Management (Canada) Inc.
Individual equities mentioned in StockTwits are not held personally or in HAC.
Horizons Seasonal Rotation ETF HAC October 30th 2014
Copyright © Don Vialoux, EquityClock.com


![clip_image002[5] clip_image002[5]](https://advisoranalyst.com/wp-content/uploads/HLIC/4bc9b4c4e072778ce825b5561d162a94.png)
