by Matt Busigin, MacroFugue
With the S&P 500 off 5% from all-time highs, and the 10-day volatility in the 87th percentile, some observers are anticipating a 1987-style market correction. In this piece, we analyze the conditions that presaged prior violent corrections.
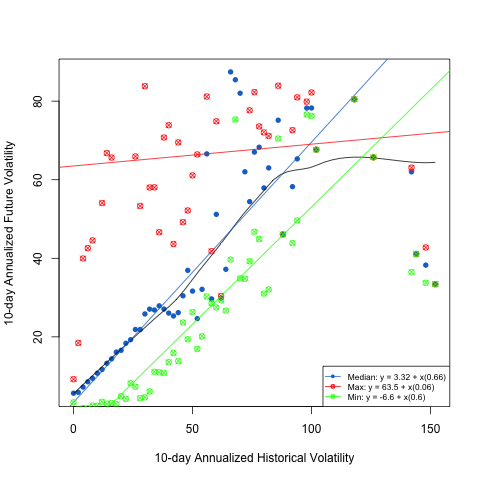
Starting with what the most recent level of volatility provides us, we split the sample of 10-day historical annualized volatility readings into 2% buckets, and calculate the median, minimum and maximum 10-day annualized volatility which immediately follows:
We estimated best fit lines using a robust linear fit to exclude outliers. The R code to generate this plot is here.
Although much of the narrative seems to indicate that an elevated level of volatility is a harbinger of higher levels of future volatility, the median case actually shows that future volatility is a fraction (2/3rds in this case) of what was recently experienced, plus a base level (of 3.32). There are outliers, of course, but they are exogenous to the relationship between realized and future volatility. To gain insight into the volatility spikes, we must look elsewhere.
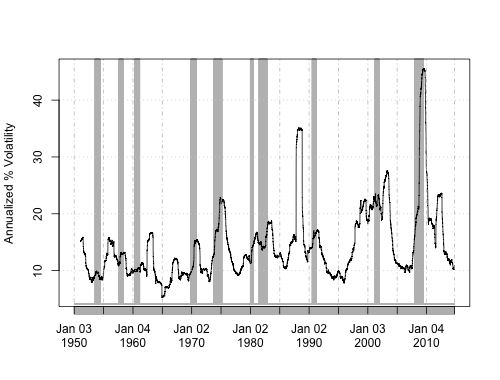
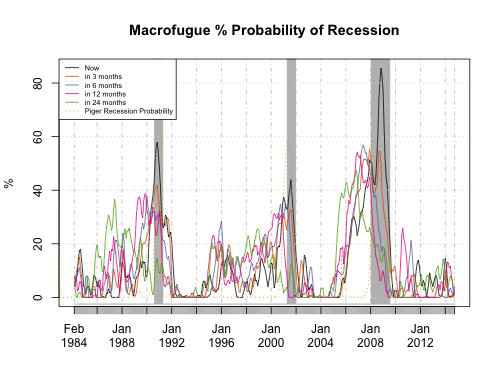
The average annualized volatility out of recession is 13.88%, while it spikes to 17.3% in recession. Volatility has only eclipsed 20% outside of recession (or impending recession) twice — the crash of 1987, and the Eurozone meltdown in 2011. Because recessions are the most common cause of volatility, we measure the probability of that kind of event with our proprietary macro model, and include University of Oregon’s Professor Jeremy Piger’s Recession Probability model for additional signal.
Absent a recession, we turn to theory. David Merkel proposes using a discounted cash flow model, whereby the stock market’s Net Present Value is determined by the expected returns in stocks (book value growth and cumulative earnings) discounted by a risk premium for uncertainty to a marginally safer asset. A materialization of this view is spreading the earnings yield and investment grade bond — a variable sometimes referred to as LERP, or the Levered Equity Risk Premium. LERP is the difference in expected returns between stocks and bonds, plus the risk premium required by investors to assume the uncertainty of owning the equity component.
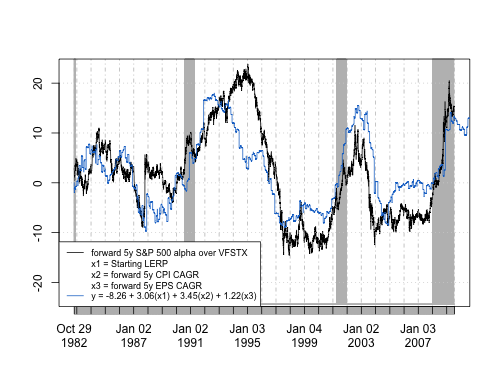
If this is true, we should be able to explain future equity outperformance of bonds by using the starting LERP value and the subsequent period earnings growth. Combined with realized inflation, we can:
More difficult is knowing exactly where the expectations differential ends and the risk premium component begins within LERP. Using the long-run historical realized equity risk premium in the above equation (3%), plugging in market inflation expectations (1.85%), and the yield of VFSTX as its expected return, we could solve for the market’s expected EPS growth, which is 1.49%:
Where x1 = 1, x2 = 1.85, y = 3…. y = -8.26 + 3.06(x1) + 3.45(x2) + 1.22(x3) 3 = -8.26 + 3.06(1) + 3.45(1.85) + 1.22(x3) 3 = 1.1825 + 1.22(x3) 3 – 1.1825 = 1.22(x3) (3-1.1825)/1.22 = x3 x3 = 1.49
Returning to the 1987 analogue, we can plug in our variables, and contrast them with now. LERP had reached the most extreme reading ever: -6.23%. 5-year inflation expectations, as measured by the Cleveland Fed series, was 4.3%. Using the same technique as above, it implied a 5-year compounded annual EPS growth of 12.3%. Spoiling the party, however, was the Fed, who jacked up rates from 5.95% to 7.62%. This had two effects:
- It increased the minimum required return by investors to over 7.62%, which they could get merely by holding cash.
- Decreased inflation expectations.
At the same time, actual realized EPS growth up until that point had been very muted in 1987, starting the year negative y/y, and only maxing out at 6.5% towards the end – well below the estimates built into the market of 12.3%. Further, with the spectre of fighting inflation very fresh, future monetary policy expectations became even firmer, as evidenced by 3s-1s curve briefly reaching a whopping 1.41%.
Using these methodologies to analyze prices, it is a very simple numeric case to make against owning equities near the top of the market in 1987.
In contrast to now, the Treasury curve is already steep (policy normalization is already priced in), inflation expectations are at generational lows and have little room to decline, LERP is +1%, and the EPS growth required to beat a 2% short-term corporate bond yield could be estimated using the above methodology at somewhere around 1.5% per year.
If we get a correction anywhere near the magnitude of 1987, or even 2011, the environment and context will bear little resemblance to the mid-cycle corrections of the past.
Copyright © MacroFugue


