


This months market breadth report focuses on the reoccurring theme, no matter which indicator we look at. Currently, majority of the breadth readings are giving us overbought readings, which doesn’t necessarily mean the market will collapse tomorrow, however it does mean that the risks are increasing and eventually a proper market correction is going to take hold.
Chart 1: S&P has once again become overbought according to HL ratio

Source: Short Side of Long
Starting with Chart 1, we should be able to observe that the 21 day moving average of NYSE new highs vs new lows ratio just hit 92% and entered the so called overbought zone. First point I would like to make is that the market doesn’t always sell off once it becomes overbought, but the reading does increase the risk of downside.
Second point is that according to this indicator, the market has not been oversold since October 2011. Furthermore, the breadth readings have been so strong that the indicator has barley dipped below 50 for the last two years or more. Therefore, the longer this artificial financial market condition goes on for, the close the reckoning day for the US equities is.
Chart 2: Advancer & up volume has been dominant over the last month

Source: Short Side of Long
Sticking with the overbought theme, we can see that the 21 day advance decline line and up vs down volume is also reaching levels usually considered to be overbought. As we can see the indicator fluctuates between overbought and oversold quite frequently and yet the market has been rising ever higher. So what does that mean? While no indicator is perfect, this one tends to be especially hard to use. The AD line & UP volume indicators are very subjective and do not give consistency of message with overbought levels.
For example, at the beginning of the rally as breadth rises towards overbought readings, smart analysts call this a “breadth thrust”. It indicates that the initial move out of a low is powerful, as majority of the market is moving in the same direction. However, a similar overbought level at the end of a trend, which is showing signs of exhaustion, tends to be a warning signal of a potential sell off. Therefore, one has to ask themselves if the current rally is at its beginning stages or in its last innings?
Chart 3 & 4: Percentage of stocks above 50 & 200 MAs are overbought!


Source: Short Side of Long
Now we come to the percentage of stocks trading above the 50 day and 200 day moving average to gauge markets conditions. Interestingly, here too the market is overbought by both of the measures (refer to Chart 3 & 4). Having said that, an investor should be able to notice that Chart 4 shows how the market has been overbought for majority of the time since late 2012 and yet pull backs have been very modest at best! So why is this indicator failing to work properly?
When the market momentum is as powerful as we are currently witnessing, many of the so called “technical indicators” lose their edge. This is because other forces take over the dominance of price and in this case everyone would agree that central banks have created an artificial financial conditions.
Nevertheless, just like in Chart 1, the percentage of stocks trading above the 50 as well as the 200 day moving averages have not been oversold for a long time. The longer the current artificial condition persists, the stronger the correction will be on the other side of mean reversion. For now… bulls continue to dominate and the trend is your friend.
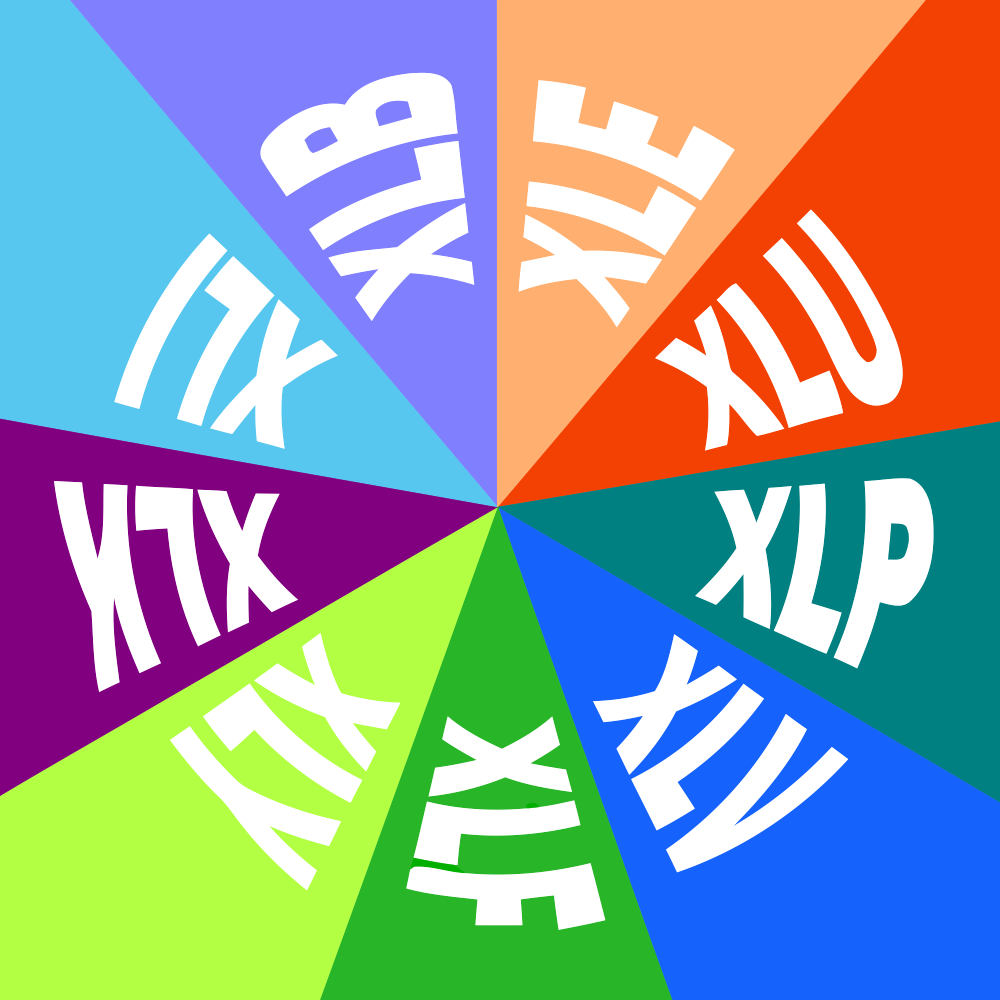
Chart 5: Currently there are no oversold sectors within US equity space

Source: Short Side of Long
Finally, as we always do, its time to have a look at the internals within each of the major sectors of the S&P 500 index. I find it very interesting that there are no oversold conditions anywhere, on any time frame, including the short term. All of the sectors are in an uptrend and all of them are positive on short & long term time frames.
Industrials, Energy and Utilities seem to be the strongest and most overbought; while Consumer Discretionary and Technology at modest breadth participation (remember that nothing is actually oversold). Finally, after a prolonged period of under-performance, Gold Miners seem to be making a comeback.
Copyright © The Short Side of Long