by Don Vialoux, Timing the Market
Pre-opening Comments for Friday June 13th
U.S. equity index futures were lower this morning. S&P 500 futures slipped 2 points in pre-opening trade.
Index futures were virtually unchanged following release of the May Producer Price report. Consensus was an increase of 0.1% versus a gain of 0.6% in April. Actual was a decline of 0.1%. Excluding food and energy, consensus was an increase of 0.1% versus a gain of 0.5% in April. Actual was a decline of 0.1%.
Intel added $1.82 to $29.78 after the company raised second quarter and annual guidance. In addition Drexel Hamilton and Roth Capital upgraded the stock to Buy.
Lululemon (LULU $37.34) is expected to open lower after the stock was downgraded by Baird, JP Morgan and Canaccord.
Marathon Oil slipped $0.05 to $39.10 after Wells Fargo downgraded the stock from Outperform to Market Perform.
Owens Illinois (OI $32.74) is expected to open higher after Bank of America/Merrill upgrade the stock from Neutral to Buy. Target price is $38.
EquityClock.com’s Daily Market Comment
Following is a link:
http://www.equityclock.com/2014/06/13/stock-market-outlook-for-june-13-2014/
Jim Cramer’s Cautious Comments on Equity Markets
(Released after the close yesterday)
Following is a link:
http://www.cnbc.com/id/101755578
Horizons/Tech Talk’s Technical/Seasonal Alert
Released Yesterday
June 12th 2014
Horizons products: HUC, HOU
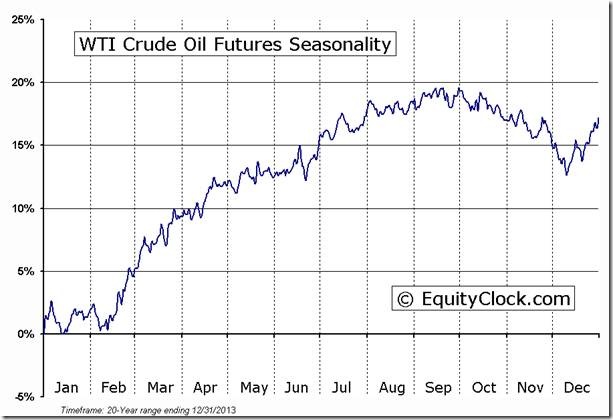
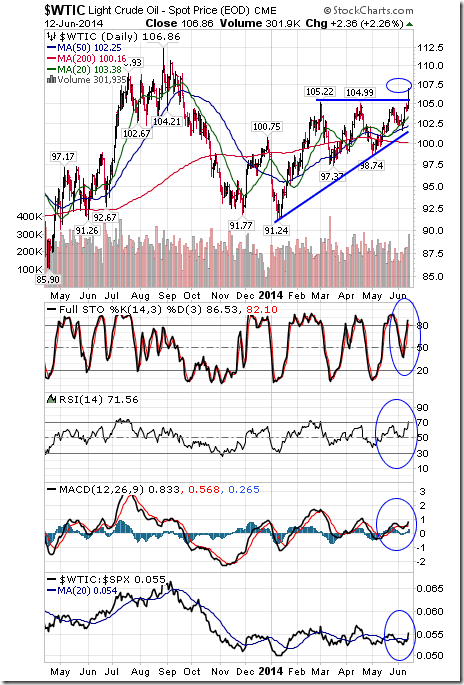
Event: An improving technical profile for crude oil ($WTIC $105.84) during its period of seasonal strength
Seasonal influences
Seasonal influences are positive from mid-February to mid-September
Fundamental influences
Crude oil prices are responding to growing international tensions that could limit oil production. Notable is the expanding conflict in Iraq that threatens continuing production from that country.
Technical Changes
This morning, WTI Crude oil broke above resistance at $105.20 per barrel to reach a nine month high. Intermediate trend changed from Neutral to Up. Momentum indicators (Stochastics, RSI and MACD) have turned higher. Crude recently bounced from near its 20 and 50 day moving averages. Strength relative to the S&P 500 Index has just turned positive.
StockTweets Released Yesterday
(Charts were added)
First signs of more breakdowns than break ups by S&P 500 stocks were recorded this morning. Four stocks broke resistance and nine broke support
Breakouts this morning by S&P 500 stocks were 4 energy stocks: $CHK, $DNR, $NBL and $XOM. In Canada, $CVE broke to new highs.
Breakdowns by S&P 500 stocks this morning were dominated by five utility stocks: $D, $DTE, $NU, $PNW and $SCG
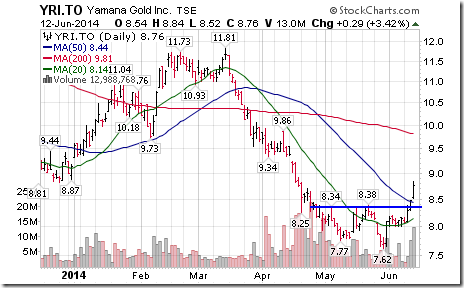
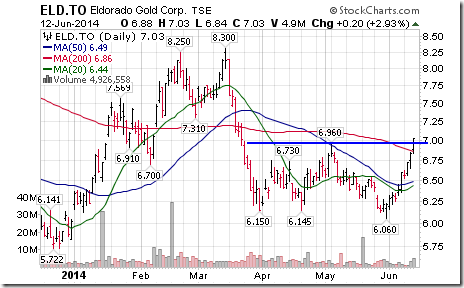
Selected Canadian Gold stocks are breaking above base patterns. Notable are $ELD.CA and $YRI.CA
Technical Action Yesterday by Individual Stocks Yesterday
By the end of the day, six S&P 500 stocks broke resistance and ten stocks broke support.
Among TSX 60 stocks, Metro broke support while Eldorado and Cenovus broke resistance
Interesting Charts
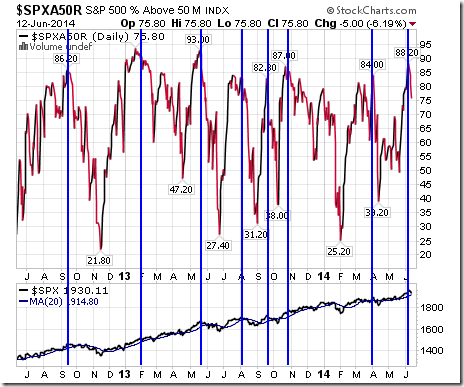
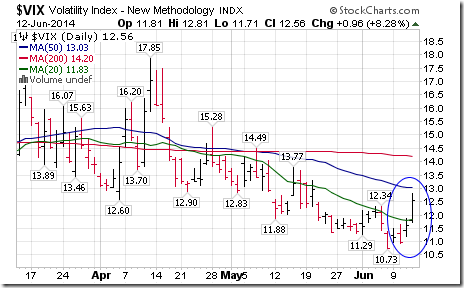
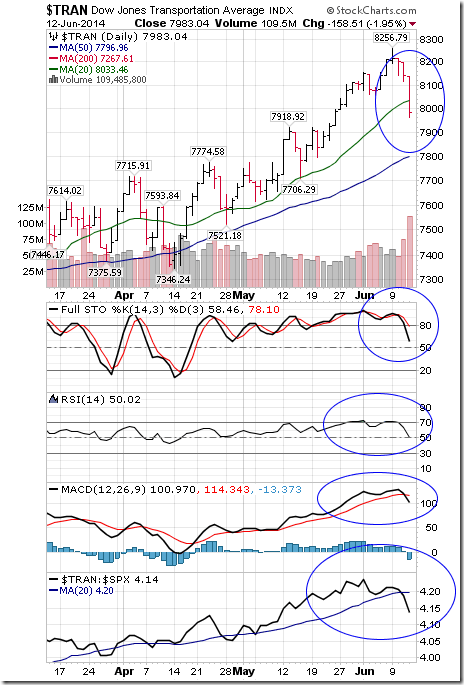
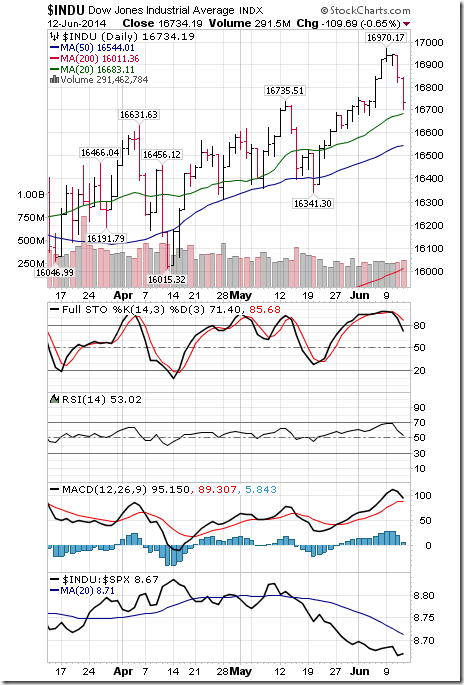
Lots of technical action yesterday that confirmed the start of an intermediate correction by U.S. equity indices and sectors!
· Percent of S&P 500 stock trading above their 50 day moving average fell below 80% yesterday.
· The VIX Index spiked.
· The Dow Jones Transportation Average broke below its 20 day moving average, recorded short term momentum sell signals (Stochastics falling below 80%, RSI falling below 70%, MACD recording a negative cross over from an overbought level) and strength relative to the S&P 500 Index turned negative.
· The Dow Jones Industrial Average has a similar chart.
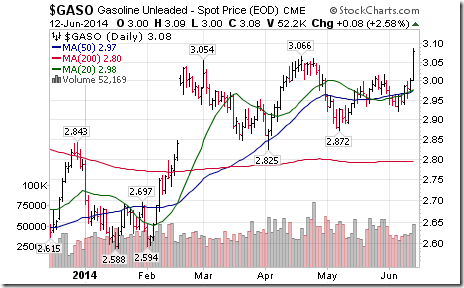
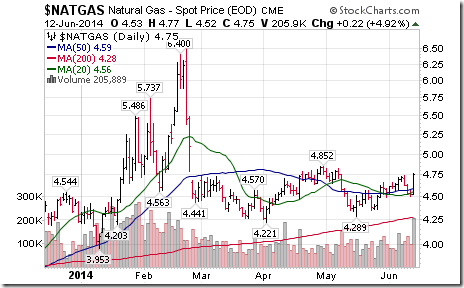
Other energy prices in addition to crude oil moved higher yesterday. Gasoline and Natural Gas moved to new recent highs.
Comments on Lululemon by Mark Liebovit
Following is a link:
http://www.youtube.com/watch?v=TVmMpl8JcwU&feature=youtu.be
Weekly Technical Review of Select Sector SPDRs
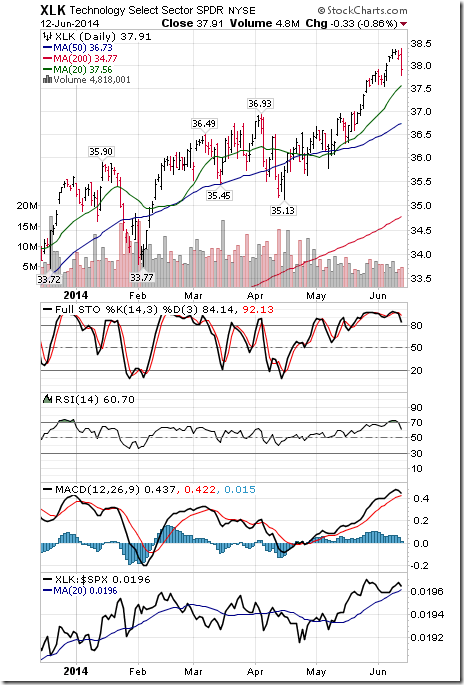
Technology
· Intermediate trend remains up (Score: 1.0)
· Units remain above their 20 day moving average (Score: 1.0)
· Strength relative to the S&P 500 Index remains positive: (Score: 1.0)
· Technical score remains at 3.0
· Trend for short term momentum indicators changed from up to down.
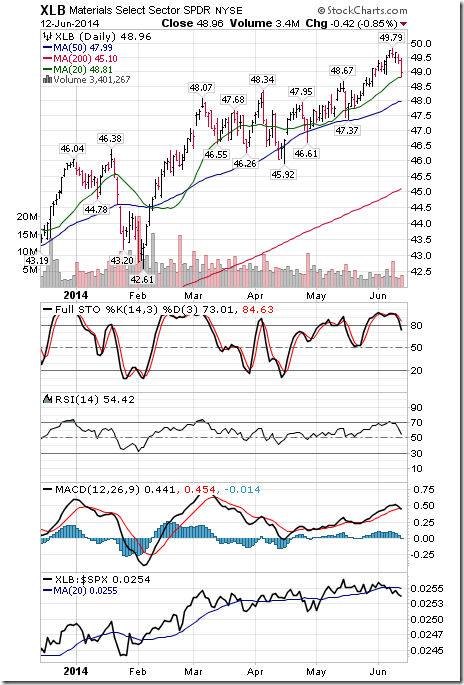
Materials
· Intermediate trend remains up
· Units remain above their 20 day moving average
· Strength relative to the S&P 500 Index changed from positive to negative
· Technical score dropped to 2.0 out of 3.0
· Trend of short term momentum indicators changed from up to down.
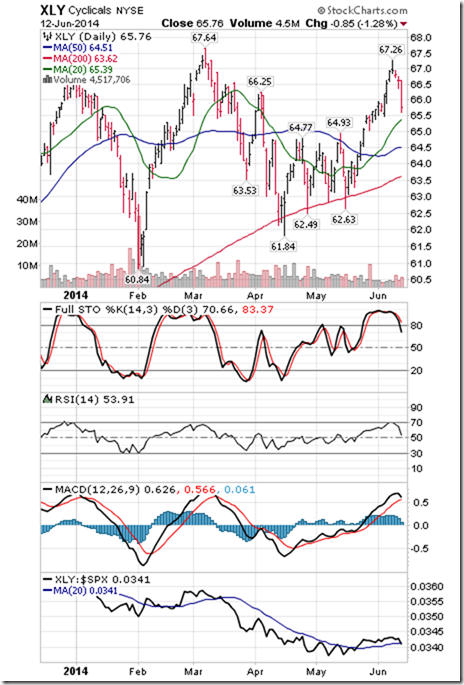
Consumer Discretionary
· Intermediate trend is up.
· Units remain above their 20 day moving average
· Strength relative to the S&P 500 Index changed from positive to neutral.
· Technical score slipped to 2.5 from 3.0 out of 3.0
· Trend for short term momentum indicators changed from up to down.
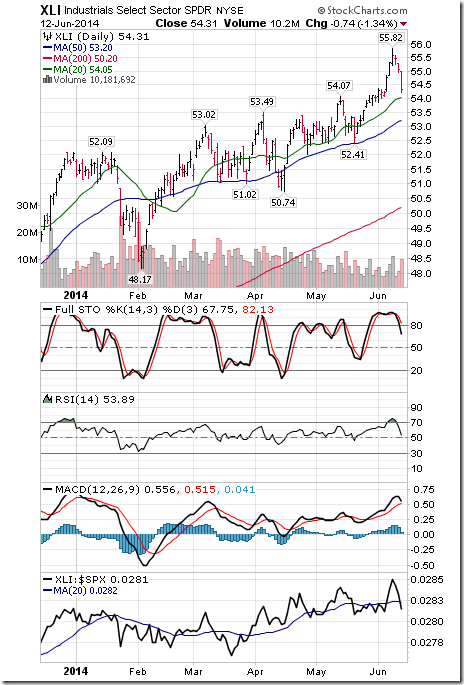
Industrials
· Trend remains up.
· Units remain above their 20 day moving average
· Strength relative to the S&P 500 Index remains neutral
· Technical score remains at 2.5 out of 3.0
· Trend for short term momentum indicators changed from up to down.
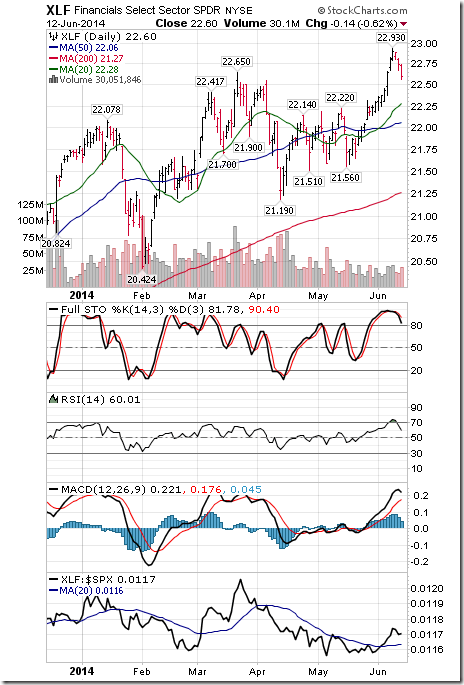
Financials
· Trend remains up.
· Units remain above their 20 day moving average
· Strength relative to the S&P 500 Index remains positive
· Technical score remains at 3.0 out of 3.0.
· Trend for short term momentum indicators changed from up to down.
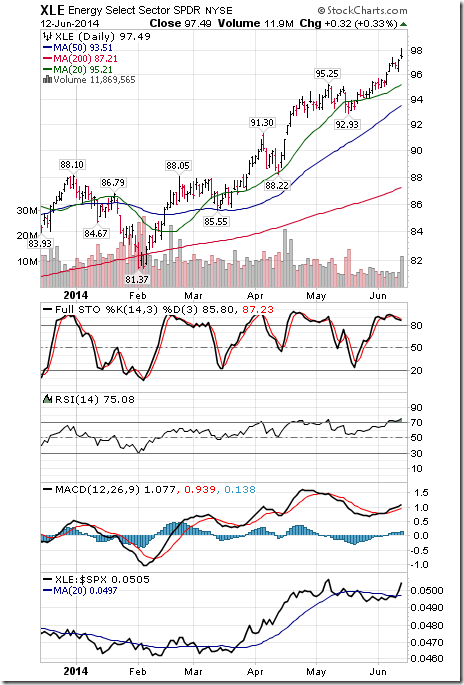
Energy
· Trend remains up
· Units remain above their 20 day moving average
· Strength relative to the S&P 500 Index changed from negative to positive
· Technical score improved to 3.0 from 2.0 out of 3.0.
· Short term momentum indicators are trending up, but are overbought.
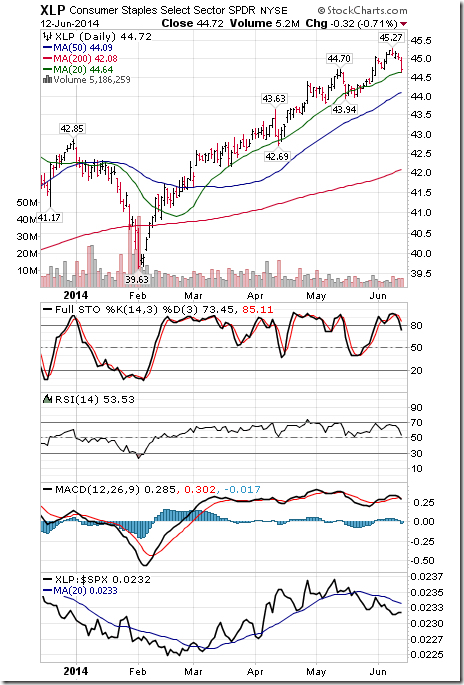
Consumer Staples
· Intermediate trend remains up.
· Units remain above their 20 day moving average.
· Strength relative to the S&P 500 Index remains negative.
· Technical score remains at 2.0 out of 3.0
· Trend for short term momentum indicators changed from up to down.
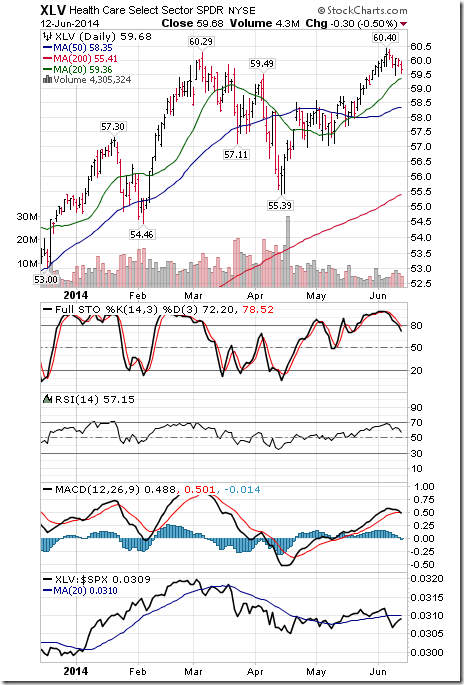
Health Care
· Trend remains up
· Units remain above their 20 day moving average
· Strength relative to the S&P 500 Index changed from positive to negative.
· Technical score fell to 2.0 from 3.0 out of 3.0.
· Trend of short term momentum indicators changed from up to down.
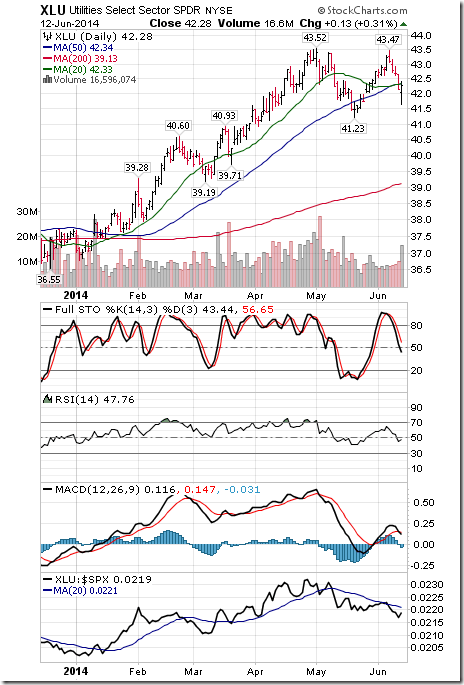
Utilities
· Trend remains up
· Units fell below their 20 day moving average
· Strength relative to the S&P 500 Index changed from neutral to negative
· Technical score dropped to 1.0 from 2.5 out of 3.0
· Trend for short term momentum indicators changed from up to down
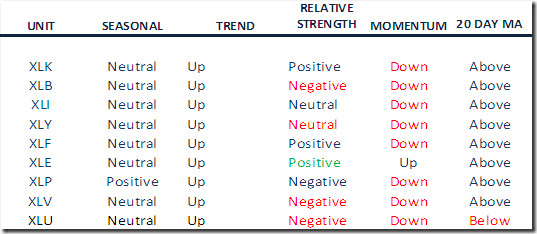
Summary of Weekly Seasonal/Technical Parameters for SPDRs
(Editor’s Note: Lots of red)
Key:
Seasonal: Positive, Negative or Neutral on a relative basis applying EquityClock.com charts
Trend: Up, Down or Neutral
Strength relative to the S&P 500 Index: Positive, Negative or Neutral
Momentum based on an average of Stochastics, RSI and MACD: Up, Down or Mixed
Twenty Day Moving Average: Above, Below
Green: Upgrade from last week
Red: Downgrade from last week
Special Free Services available through www.equityclock.com
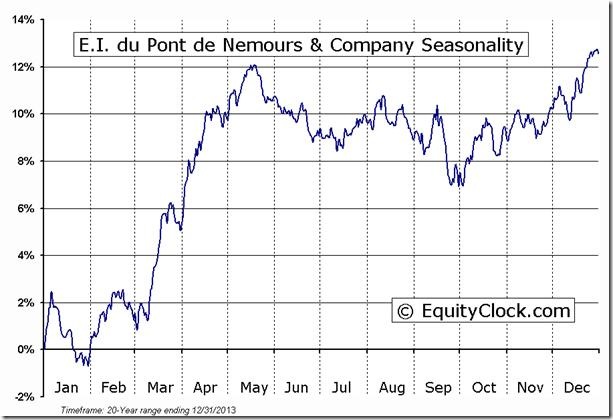
Equityclock.com is offering free access to a data base showing seasonal studies on individual stocks and sectors. The data base holds seasonality studies on over 1000 big and moderate cap securities and indices. To login, simply go to http://www.equityclock.com/charts/
Following is an example:
Disclaimer: Comments, charts and opinions offered in this report by www.timingthemarket.ca and www.equityclock.com are for information only. They should not be considered as advice to purchase or to sell mentioned securities. Data offered in this report is believed to be accurate, but is not guaranteed. Don and Jon Vialoux are Research Analysts with Horizons ETFs Management (Canada) Inc. All of the views expressed herein are the personal views of the authors and are not necessarily the views of Horizons ETFs Management (Canada) Inc., although any of the recommendations found herein may be reflected in positions or transactions in the various client portfolios managed by Horizons ETFs Management (Canada) Inc.
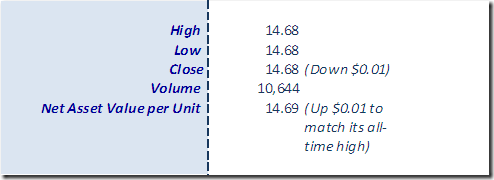
Horizons Seasonal Rotation ETF HAC June 12th 2014
Copyright © Don Vialoux, Jon Vialoux, Brooke Thackray


