With the changes this week in the SIA Asset Class Rankings there have been many advisors calling in to discuss these changes and the possible implications to client portfolios. So, for this week's SIA Equity Leaders Weekly, we are going to focus on how important the overall Macro outlook is with the SIA Equity Action Call and then add in the importance of tracking the asset class rankings.
Canadian Equity Action Call Model
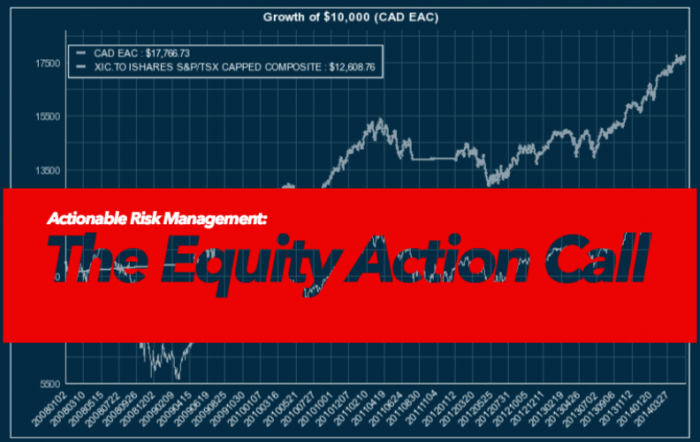
Looking at the first chart, what this shows is a very simple model that advisors should likely have inside their own "My Models" to help with marketing. This chart depicts using the SIA Equity Action Call (EAC) to go to a Money Market Fund (CMR.TO) when the Equity Action Call goes into the Unfavored zone, and then merely buying the XIC.TO once the SIA Equity Action Call becomes Favored again. We are not trying to beat the benchmark, just moving out of it when the EAC dictates to do so. Going back to the beginning of 2008, the XIC.TO (iShares S&P/TSX Capped Composite) is up 3.68% annualized, while the model is up 9.37%. Using the EAC has helped to reduce the overall risk profile, which in turn has helped to improve performance.
Click on Image to Enlarge

CAD/US Equity Action Call Model
The second chart now goes a step further in reducing risk/adding performance by adding in the SIA Asset Class Rankings. To create this new model, we once again used the EAC to tell us when to move out of the Equity Markets, but this time we either bought the XIC.TO, or the IVV (iShares Core S&P 500 ETF) depending upon which Asset Class was currently stronger between the U.S. and Canada. As you can see from the chart, when the EAC moved us back into the markets in early 2012, going with the U.S. as the stronger market added tremendously to the performance of the model, and also reduced risk by decreasing the potential downside losses that occurred versus staying in Canada. In this case, the CAD model returned 9.37% historically, while staying with the strongest market between CAD or U.S. did 13.97%.
With Canada now moving in as the #1 asset class this week, and the US dropping down to #3, it is easy to see how big of a difference staying with the strongest asset classes has been historically.
Click on Image to Enlarge

SIACharts.com specifically represents that it does not give investment advice or advocate the purchase or sale of any security or investment. None of the information contained in this website or document constitutes an offer to sell or the solicitation of an offer to buy any security or other investment or an offer to provide investment services of any kind. Neither SIACharts.com (FundCharts Inc.) nor its third party content providers shall be liable for any errors, inaccuracies or delays in content, or for any actions taken in reliance thereon.
Feel free to contact the SIA Team at siateam@siacharts.com or 1-877-668-1332 if you would like more information on this analysis.
Copyright © SIACharts.com