For this week's Equity Leaders Weekly, we are going to examine one of the most popular investment "catch phrases" of the last 2 decades ... "Time in the Market vs Timing the Market". This has arguably become one of the most polarized debates within the investment industry between the "Buy & Hold" camp and the "Market Timing" camp. This topic has become so divisive that it often appears to the average investor that there are only two options available, either to blindly Buy & Hold and hope for the best or to get out your crystal ball and trade aggressively. We believe there is a third option that is rarely discussed ... a Relative Strength system that combines the best of both approaches into ONE disciplined but adaptive strategy.
“Time in the Market vs Timing the Market”
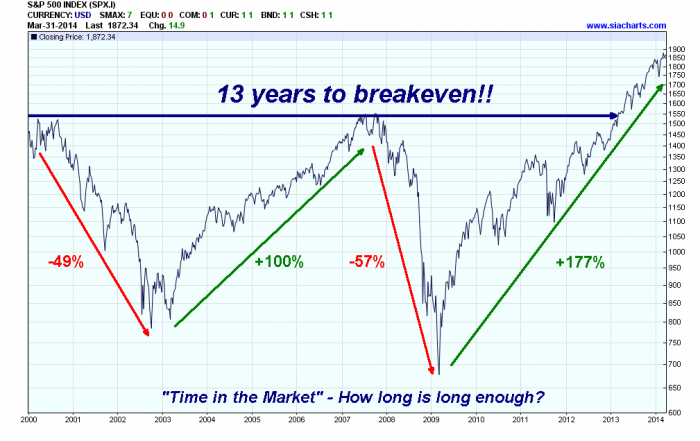
The mantra for the “Buy & Hold” camp has been that the key to successful investing over the long term is “Time in the Market”. They argue that over the very long term the stock markets have been upward sloping and the probability of losing money decreases as your time horizon increases. Therefore success will eventually be achieved if you are in the market long enough. The logical question then becomes, “How long is long enough?” A look back at recent history (see chart) shows the S&P500 Index taking 13 years to exceed its previous high in 2000. Prior to this, the last secular bear market in the U.S. during 1966 – 1982 lasted roughly 17 years where the market went sideways. And if an investor was unlucky to invest at the top of the market in 1929 before the Great Depression, it took 25 years for the U.S. stock market to reach its 1929 price levels. It would then be argued that the Buy & Hold approach, while admittedly is a bumpy ride at times, is still more effective than trying to time the market. The popular Dalbar study is cited that calculated the returns of the average investor and proved their inability to time the market by earning nearly 8% less compounded annually than the S&P500 Index from 1986 – 2005. However, this study actually proves another important point that is rarely discussed, which is the unrealistic expectation of investors to be able to stick to this strategy. If they couldn’t stick to a Buy & Hold strategy during THE STRONGEST BULL MARKET ON RECORD in the U.S. during 1982-2000, which would have been the easiest time to do so, how can one expect them to adhere to it during a period characterized by extreme cyclical bull and bear markets? Simply suggesting that investors continue to increase their time horizon if they are still below water, is neither prudent nor practical advice in our opinion!
Click on Image to Enlarge
“Aligning with the Market” - A Relative Strength Solution
Much of the debate against “Timing the Market” has been focused on the poor track record of investors and analysts alike at “predicting or forecasting” the future price movements of any market or investment. And we agree with the dismally poor track record of those who have tried to “predict or forecast” the future direction of the markets. Prediction or forecasting is very subjective and incredibly difficult to do effectively on a consistent basis because you are dealing with an event that hasn’t happened yet! And even if you think the data seems pretty clear about the future direction of an investment, the most important piece of information you can’t predict is “how the masses will react” to that same data! As a result, the industry spends most of its time explaining why there is a “disconnect” between the fundamentals of the market and the price action of the market. Not time well spent! However, we believe there is another option. It’s not about trying to subjectively “Time the Market” but objectively “Align with the Market”. Relative Strength is a methodology that enables us to objectively track the supply and demand characteristics of any market or investment. This provides us with a powerful indicator of the money flows on a large scale. By doing this we don’t need to predict or forecast what might happen in the future, but simply align ourselves with what is happening in the markets today. The second chart illustrates how we aligned ourselves with the strength of the market over the past 9 years by highlighting the Top 3 Asset Classes at specific points in time based on our SIA Relative Strength Asset Allocation Model. In addition, we overlay our proprietary Relative Strength Risk Management Tool called our “Equity Action Call” (EAC) to guide our decisions about when we should be in the markets versus safely on the sidelines. This indicator enabled us to avoid the 2008-2009 bear market by alerting us to a shift in strength of Equities vs Fixed Income and Cash. Relative Strength enables us to align ourselves with the market using a Rules Based, Objective, Unbiased and Unemotional approach to investing!
Click on Image to Enlarge

Call or email us to request this article in PDF format at 1-877-668-1332 or siateam@siacharts.com.
SIACharts.com specifically represents that it does not give investment advice or advocate the purchase or sale of any security or investment. None of the information contained in this website or document constitutes an offer to sell or the solicitation of an offer to buy any security or other investment or an offer to provide investment services of any kind. Neither SIACharts.com (FundCharts Inc.) nor its third party content providers shall be liable for any errors, inaccuracies or delays in content, or for any actions taken in reliance thereon.
Copyright © SIACharts.com