
For this weeks SIA Equity Leaders Weekly, we are going to address a statement made by an analyst who was interviewed on TV recently. He said, "I don't believe in buying stocks that have reached new highs as they are more risky, instead I prefer to buy stocks that have been beaten down as they provide a lower risk opportunity." Let's examine this belief to find out if it is good advice for investors. To do this, we will focus our attention on the stocks within the S&P/TSX 60 Index.
TSX 60 Index (TX60.I)
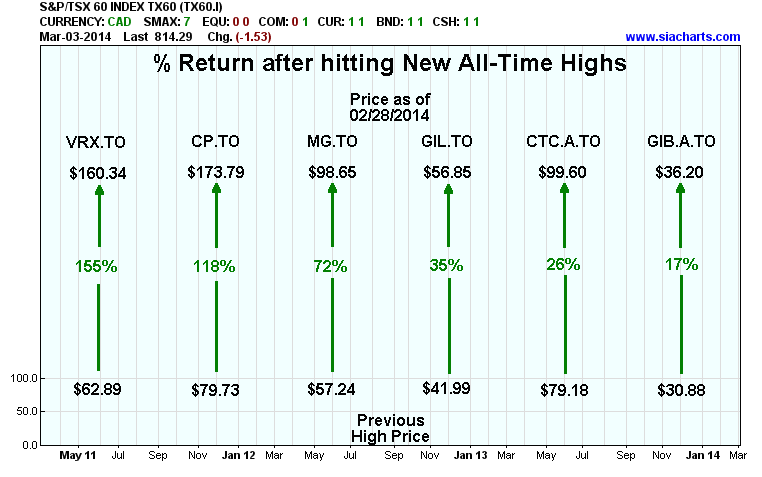
Many investors believe that you shouldn't buy stocks that have reached new highs because they are a greater risk than stocks that have dropped significantly. We looked at the Top 10 best performing stocks on the TSX 60 Index for the 2013 calendar year. Of those Top 10 stocks for 2013, 6 of them reached new all-time highs (based on dividend adjusted closing price) within the last 2 years as illustrated on the chart to the right. We list the "Previous High Price," then the "Price as of 02/28/2014" to demonstrate how the stock price performed after reaching new highs. All 6 stocks reached their new all-time high closing prices within the last 2 years so this chart uses very recent stock examples. In each case, the stock price continued to increase dramatically AFTER exceeding its all-time highs and generated superior outperformance for its investors. The average return across these 6 stocks after they reached their all-time highs was 70%. The lost opportunity cost for those investors that sold these stocks after reaching new highs was very signficant. The important thing to understand here is that just because a stock has reached a new high doesn't mean it's more risky, as long as it continues to show stronger Relative Strength vs its peer group. This means the supply/demand relationship is still favourable for that stock and therefore continues to experience positive money flows!
The Relative Strength Methodology helps to answer the question, "Should I sell stocks that have reached new highs?" The answer is "NO" as long as it continues to show stronger Relative Strength vs its peer group.
Click on Image to Enlarge
TSX60 Index (TX60.I)
Many investors believe that you should buy stocks that have experienced significant corrections because they are lower risk than stocks that have increased significantly. We looked at the Bottom 10 worst performing stocks on the TSX60 Index for the 2013 calendar year. We list the "Price after 25% Decline from 3 yr High" (dividend adjusted closing price). This calculates what the price was AFTER it declined 25% from its 3 yr high. We chose the last 3 year timeframe to make this example relevant to investors today, especially since many investors have held these stocks over this timeframe. Surely, these would be good stocks to buy after they had dropped 25%, because they would be less risky right? Well, then we looked at what the closing price was on Feb.28, 2014. In 8 out of the 10 stocks, the stock price continued to decline dramatically even after already declining 25% from its 3 year high. Investors who bought these stocks even after they had declined 25% experienced significant losses afterwards. So instead of these stocks being less risky after they had fallen 25%, they proved to be very risky to clients' portfolios. The average loss for these 8 stocks after they had declined 25% was -44%. The important thing to understand here is that just because a stock has declined significantly in price doesn't mean that it's less risky, as long as it continues to show weaker Relative Strength vs its peer group. This means the supply/demand relationship is still unfavourable for that stock and therefore continues to experience negative money flows!
The Relative Strength Methodology helps to answer the question, "Should I buy stocks that have declined significantly in price?" The answer is "NO" as long as it continues to show weaker Relative Strength vs its peer group.
Click on Image to Enlarge

SIACharts.com specifically represents that it does not give investment advice or advocate the purchase or sale of any security or investment. None of the information contained in this website or document constitutes an offer to sell or the solicitation of an offer to buy any security or other investment or an offer to provide investment services of any kind. Neither SIACharts.com (FundCharts Inc.) nor its third party content providers shall be liable for any errors, inaccuracies or delays in content, or for any actions taken in reliance thereon.
Copyright © SIACharts.com