
Back on July 18 of last year for the Equity Leaders Weekly, we discussed the common mistake advisors make by not purchasing positions that are at the top of their Favored zone in the report, as they have been up there for "too long," "the chart is parabolic," etc. We then went on and looked at 2 specific examples: VRX.TO which was number 1 in the S&P/TSX 60 Report at that time and also HD which was number 1 in the S&P 100 Report. For this weeks SIA Equity Leaders Weekly, we are going to revisit those 2 positions again and see how they have fared, and what action we could have taken if necessary.
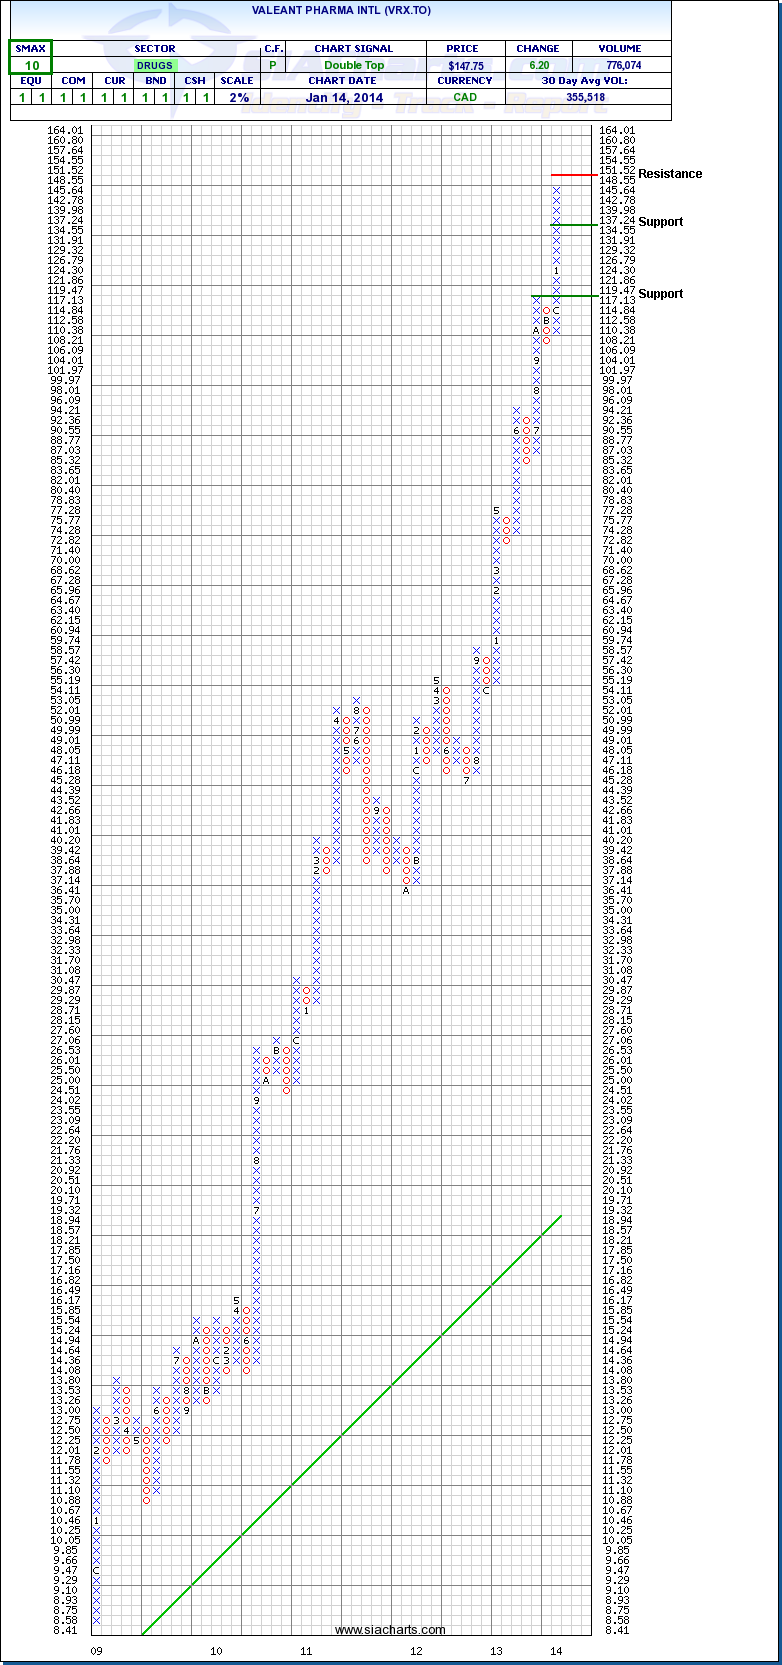
Valeant Pharma Intl (VRX.TO)
Since we last looked at Valeant Pharma (VRX.TO), this stock has continued to sit in the top spot in the S&P/TSX 60 Report and has moved on to new highs. Back in July, VRX.TO was at $94.93, so it has moved almost 60% higher since that time. This provides a great example of how continuing to hold your strong positions really works out in your favor, instead of selling them to take a quick profit and guessing at a weaker position to buy. We continue to hold positions like VRX.TO as long as they remain in our Favored zone, and as long as our SIA Equity Action Call and SIA Asset Class Rankings dictate we should be in such positions. Currently, VRX.TO is showing both long-term strength from its high relative strength ranking and near-term strength with a 10 out of 10 SMAX score against other asset classes.
Click on Image to Enlarge
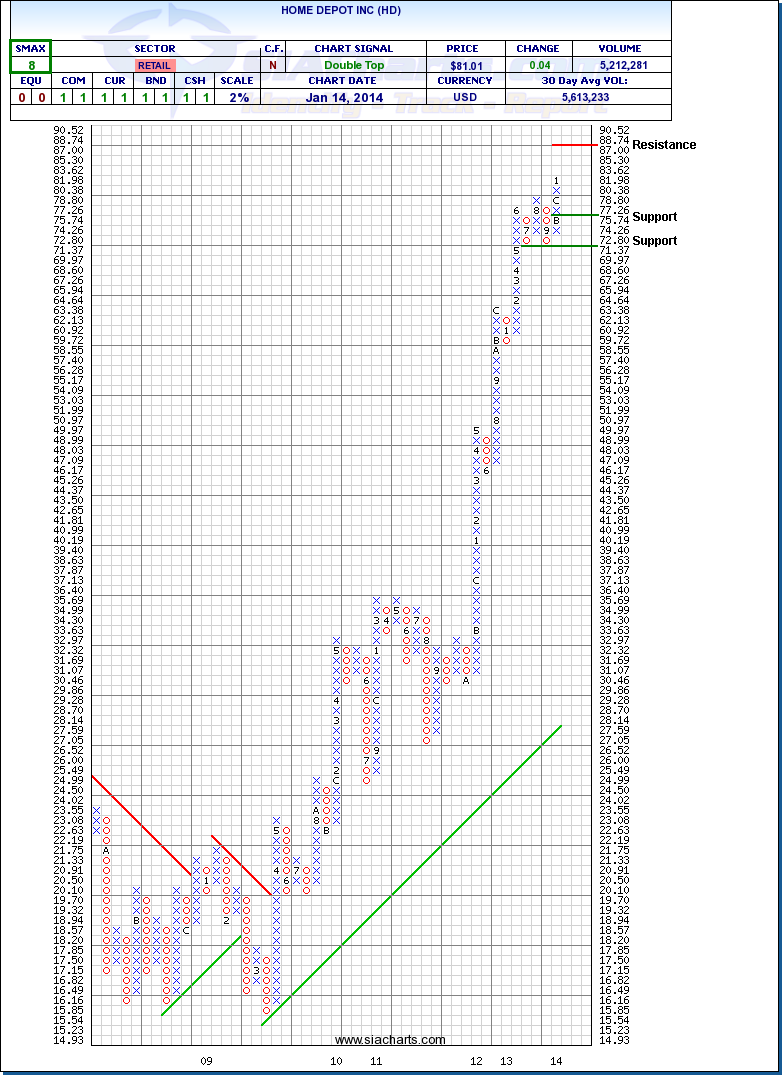
Home Depot (HD)
The second position we looked at was Home Depot. Unlike VRX.TO above, HD instead has worked its way down through the Favored zone in the SIA S&P 100 report and is now sitting in the 26th spot, which is the first spot in the Neutral zone of the report. It continues to remain a holding as our 3 secondary sell indicators have not triggered yet (for those wanting more info on our SIA Trigger Points, please refer to the PDF in our education tab).
This provides an opportunity to answer another common question that we receive, which is "How much of a loss does a stock normally take before it falls out of the Favored zone?" This question is very difficult to answer because it really depends on the actions of the peer group in the report that it is being compared to. We really can't put a number on what the drop may be or if there even is a drop at all. Lets look closer at our example of HD and see what happened.
Back in July, HD was trading at $80.22. Moving up to present day the stock is now at $81.02. We only saw a gain of 1%, but what is important to understand out of this is what it did versus the peer group. The peer group continued to move higher, and so did HD, but not nearly by as much. As a result, it has now fallen in relative strength and could be traded out very soon in favor of a stronger position and can now be reevaluated since it is in the Neutral zone.
Not all trades end up working out like Valeant Pharma. Some may end up being a loss, and some may have some marginal gains. But by staying up in the Favored zones of the reports, we continue to look at reducing risk and maximizing our potential for outperformance, which is what every client is looking for. Cut your losses short, and let the winners run.
Click on Image to Enlarge
SIACharts.com specifically represents that it does not give investment advice or advocate the purchase or sale of any security or investment. None of the information contained in this website or document constitutes an offer to sell or the solicitation of an offer to buy any security or other investment or an offer to provide investment services of any kind. Neither SIACharts.com (FundCharts Inc.) nor its third party content providers shall be liable for any errors, inaccuracies or delays in content, or for any actions taken in reliance thereon.