Macro View: Party Like it's 1999
November 06 2013
There remains significant upside for risk assets, but in this liquidity-driven market there is also an increasing risk of a “melt-up” such as the one that preceded the bursting of the tech bubble in early 2000.
by Scott Minerd, CIO, Guggenheim Partners
There is little expectation in the market of tapering quantitative easing (QE) before the second quarter of 2014. The term taper has become a dirty word at the Federal Reserve, which may now have to come up with a new euphemism (perhaps "slimming") before it next raises the notion that it might reduce its asset purchases. Combined with seasonal factors, excessive Fed-driven liquidity is providing a green light for risk assets in the United States, and even more so, internationally. Waves such as this only last so long before crashing, and as anyone who is familiar with surfing knows, you better get off the wave before it reaches the shore. Today, the shore appears a long way off, but it is there and should still be considered as investors formulate their strategies.
In some ways, the present environment has parallels with the fourth quarter of 1999 when the Federal Reserve increased the monetary base by 12 percent to offset Y2K fears. When the new millennium came, people feared that computers, which had been coded to only understand dates in two digits, would not be able to comprehend the arrival of a new century and a systemic computer melt down would ensue -- airplanes would drop from the skies and the banking system, including every corner ATM, would shut down. In the present era of QE-to-Infinity, a 12 percent increase in the monetary base may seem insignificant, but at the time, the liquidity injection helped fuel a massive melt-up in stocks. The Nasdaq, for instance, saw an 85 percent gain between September 30st of 1999 and March 10th of 2000, crashing 72 percent by the third quarter of 2001 as the tech bubble popped.
I am not calling for the stock market to see gains of that magnitude over the next six months (nor did the broader market in 1999-2000), but the bottom line is that we are awash in liquidity and heading into a seasonally strong period, indicating a significant risk of a melt-up. At a minimum, we could see a wholesale increase in equities, bonds, and high-yield prices despite the declining attractiveness of valuations, which should cause investors to exercise greater caution. The looming transition at the Fed from a Chairman Bernanke to a Chairman Yellen will likely only add to uncertainty during the first quarter of 2014.
Chart of the Week
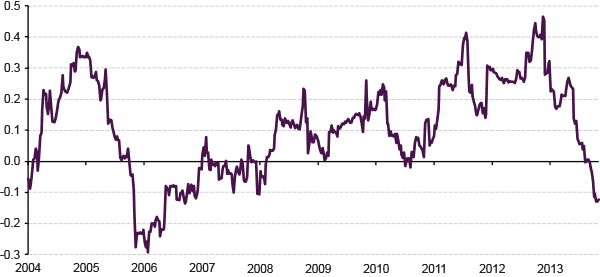
Fed Policy Increasingly Driving U.S. Equity Outlook
The 52-week correlation between S&P 500 returns and the change in the Citigroup Economic Surprise Index has plunged from 0.45 to -0.13 over the past 12 months. A negative correlation indicates that weak U.S. economic data tends to push equity prices higher, while strong economic data tends to send them lower.
In a similar manner to 2005, when the Federal Reserve raised interest rates by 200 basis points in a year, the current plunge in this correlation indicates that the expectation of continued monetary accommodation has trumped economic fundamentals to become the main factor determining the near-term outlook for U.S. equities.
ROLLING 52-WEEK CORRELATION COEFFICIENT BETWEEN S&P 500 RETURNS AND CHANGE IN U.S. ECONOMIC SURPRISE INDEX*

Source: Citigroup, Bloomberg, Guggenheim Investments. Data as of 11/4/2013. *Note: The Citigroup Economic Surprise Index is defined as weighted historical standard deviations of data surprises, which are the difference between actual releases and consensus estimates. A positive reading of the index suggests that economic releases have on balance been beating consensus.
Economic Data Releases
Most Indicators Positive before GDP and Jobs Report
- The ISM manufacturing index beat expectations in October, rising to 56.4, the highest in two and a half years.
- The ISM non-manufacturing composite rose to 55.4 in October after falling in September.
- The leading indicator index increased 0.7% in September, the third consecutive month of positive indicators.
- Initial jobless claims decreased for a third straight week, down to 340,000 for the week ended October 26.
- Factory orders rose 1.7% in September after ticking down 0.1% in August.
- Mortgage applications dropped 7.0% for the week ended November 1, the largest drop in two months. Purchase applications fell to the lowest amount this year.
- The Chicago PMI jumped to 65.9 in October, the best reading since March 2011.
- Vehicle sales fell for a second consecutive month to the lowest level this year, 15.2 million.
Inflation Falls to Four-Year Low in the Euro Zone
- Euro zone retail sales fell 0.6% in September after rising the previous two months.
- The euro zone unemployment rate was 12.2% in September, continuing to reach all-time highs.
- The euro zone CPI year-over-year growth fell to 0.7% in October, the lowest in four years.
- German retail sales unexpectedly dropped for a second consecutive month, down 0.4% in September.
- German GfK consumer confidence ticked down to 7.0 from October’s six-year high of 7.1.
- German factory orders surged 3.3% in September, beating estimates of 0.5% after declining for two months.
- U.K. industrial production rose a better-than-expected 0.9% in September.
- House prices in the U.K. reached year-over-year growth of 5.8% in October, the highest since July 2010.
- The U.K. services PMI jumped to 62.5 in October, the highest on record.
- China’s manufacturing PMI rose for a fourth straight month to 51.4 in October, the best since April 2012.
- The HSBC China manufacturing PMI was unchanged from the flash estimate at 50.9.
- China’s HSBC services PMI ticked up 52.6 in October from 52.4 in September.


