November 4, 2013
by Liz Ann Sonders, Senior Vice President, Chief Investment Strategist, Charles Schwab & Co., Inc.
Key Points
- The risk of a melt-up in stocks is garnering more attention; and is something we've been discussing recently, too.
- Sentiment does appear stretched in the near-term and warns of a possible pullback.
- But there are few, if any, bubble-like conditions present and fundamentals ex-sentiment appear healthy.
Is the crowd on the street looking around the corner for the next crisis to unfold getting smaller? The "wall of worry" has been a consistent characteristic, and driver, of the stock market since its epic low in March 2009. Is that wall starting to crumble? Crumble, no; but there are a few bricks that have been pried loose. One of my themes this year has been the market's resilience to some ongoing bad news—including political dysfunction, weak economic growth and Fed policy uncertainty. One "risk" in particular I've highlighted is that the stock market could experience a melt-up. I put risk in quotes because as good as melt-ups feel while it's happening, they don't end well.
Including the reinvestment of dividends, the S&P 500 is up about 180% since its March 2009 low and it's been over two years since the last correction (a drop of at least 10%).
Melt-up?
It's interesting to see the reactions among clients and other investors to the melt-up story. It's been a mixed bag here in the United States, with more bearishly-inclined investors incredulous that it is even a possibility. I was in London this past May and when I brought up the subject at a small investor dinner, the debate became particularly heated between the melt-up believers and non-believers. More interesting was my experience in China last week, where there was much more enthusiasm about the possibility of a melt-up (highlighting the more trading-orientation of investors there in US stocks).
I am in good company with a melt-up concerns: Two of my long-time friends in this business- famed economist Ed Yardeni and famed strategist Laszlo Birinyi (with whom I shared the stage on Wall $treet Week With Louis Rukeyser)—have been warning of the risk of a melt-up. Like me, they remain bullish, but are keeping an eye on sentiment risks.
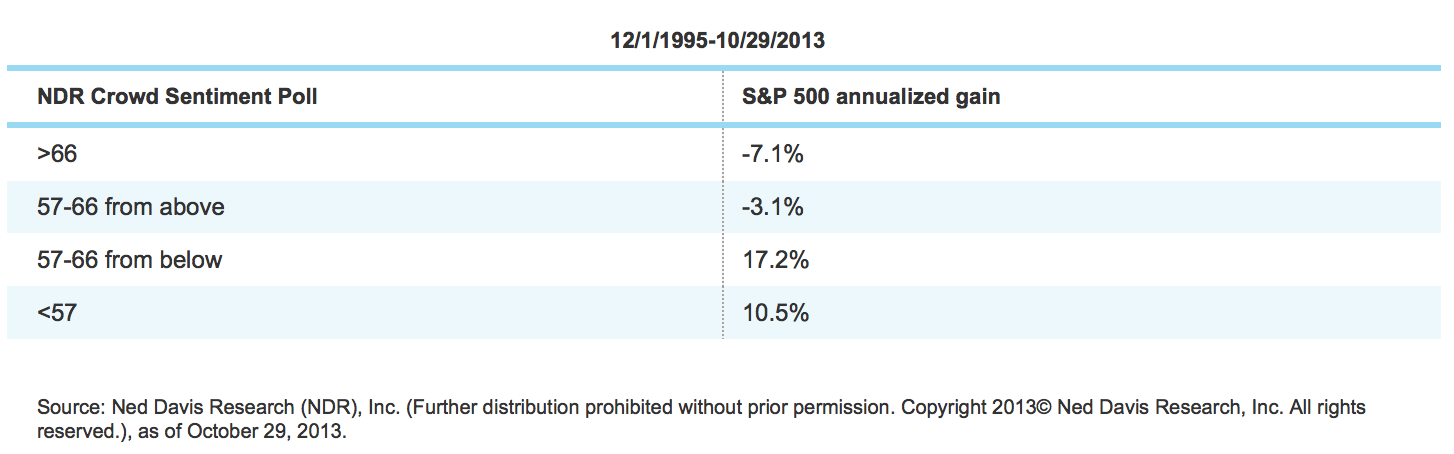
Sentiment does look a bit stretched in the short-term, with both the Ned Davis Crowd Sentiment Poll and SentimenTrader's Smart Money/Dumb Money Confidence Poll showing elevated (extreme) levels of optimism. The former should be very familiar to readers as it's my go-to sentiment indicator because it's an amalgamation of seven distinct indicators. The latter is one I haven't shown in some time, but it is flashing a bit of a warning presently
These both suggest there is a growing near-term risk of a pullback.
Investor sentiment shoots higher

"Dumb money" increasingly confident
Source: www.sentimenTrader.com, as of November 1, 2013. Examples of some Smart Money indicators include the OEX put/call and open interest ratios, commercial hedger positions in the equity index futures, and the current relationship between stocks and bonds. Examples of some Dumb Money indicators include the equity-only put/call ratio, the flow into and out of the Rydex series of index mutual funds, and small speculators in equity index futures contracts.
SentimenTrader has been studying the spread between "smart money" and "dumb money" confidence for over 20 years. Their Confidence indices use mostly real money gauges—they don't rely on opinions. Generally, investors should follow the Smart Money traders when they reach an extreme; while doing the opposite of what the Dumb Money is doing at extremes.
The table below the chart shows how the S&P 500 performed 90 days after "buy signals" (when Smart Money Confidence was above 60% at the same time the Dumb Money Confidence was below 40%) and "sell signals" (when Smart Money Confidence was below 40% at the same time the Dumb Money Confidence was above 60%). Clearly, we are in a higher risk zone presently.
Fundamentals
But the underlying fundamentals of the stock market are not near flashing a major warning signal; even with stocks trading at all-time highs. In client presentations around the world this year, I've been comparing the fundamentals today given all-time highs, with the last two periods when the stock market was at all-time highs: 2000 and 2007. I've been splitting the analysis into two compartments that I've simplistically noted as the "bad stuff" and the "good stuff."
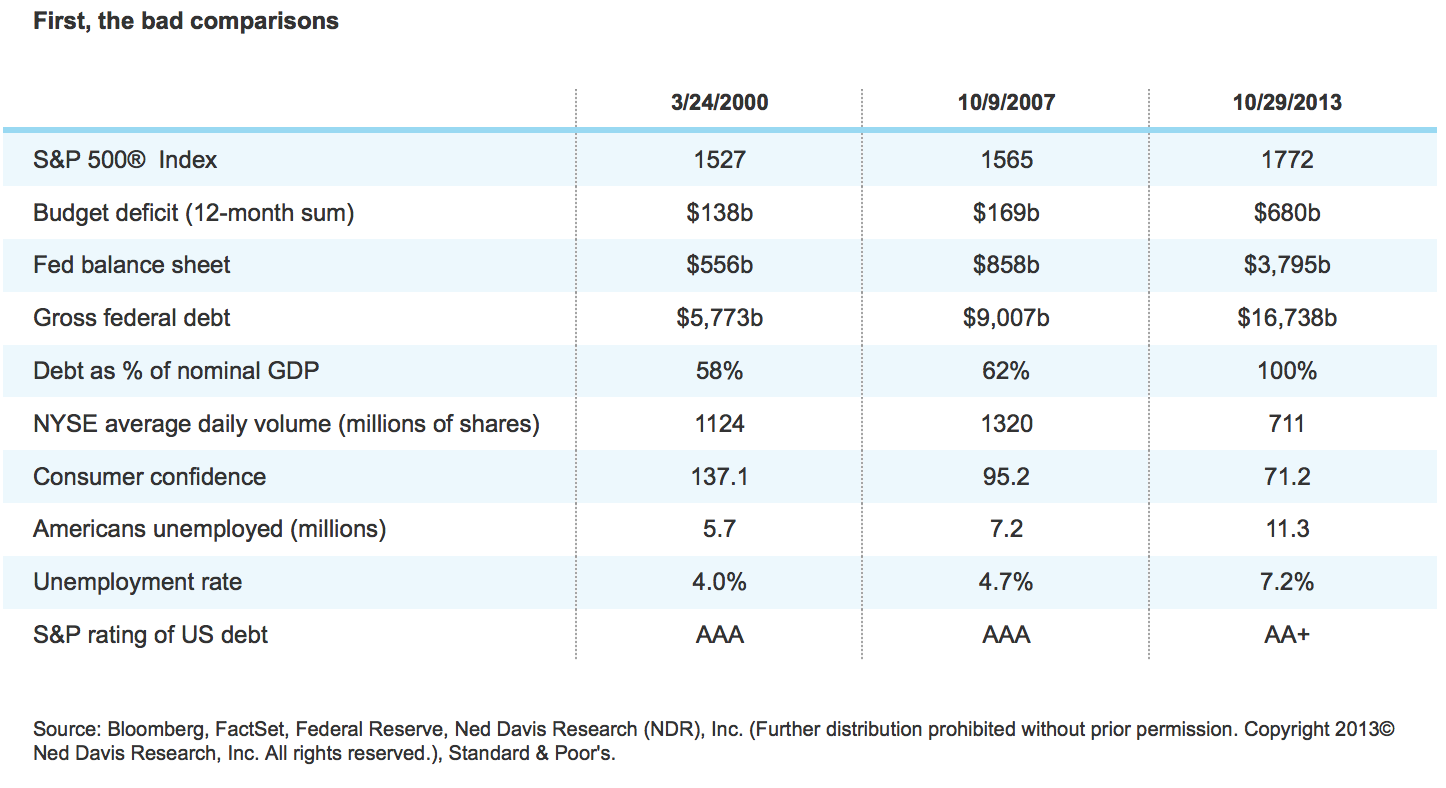
As you can see, most of the negative comparisons are more macro in nature and heavily skewed toward debt and employment statistics.
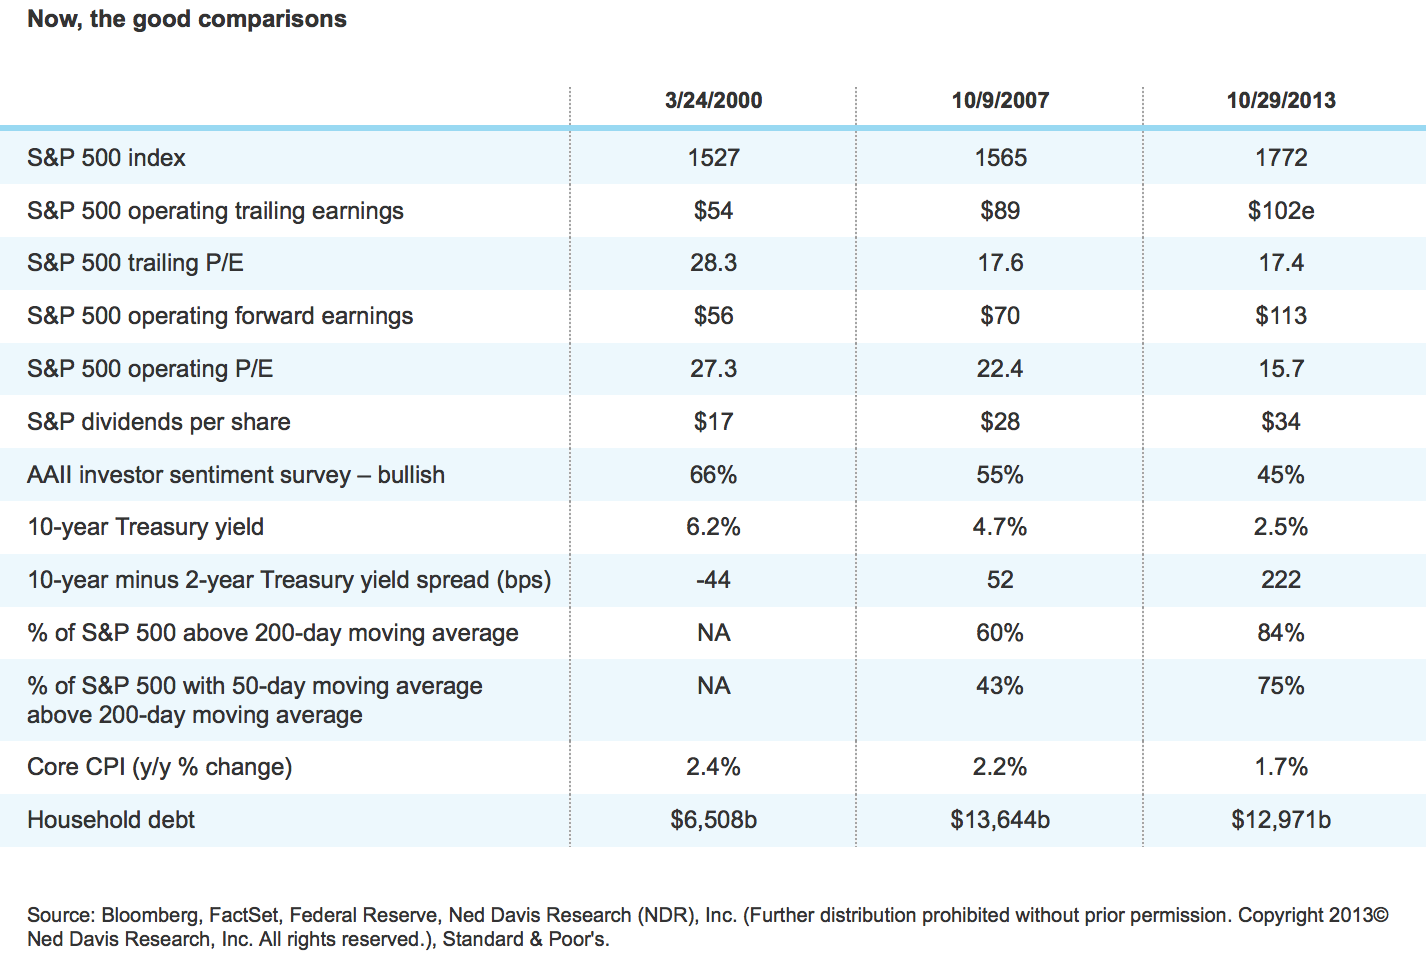
As you can see, most of the positive comparisons are more fundamental in nature and show that earnings, valuation, dividends, rates/inflation and the market's technical conditions all look favorable.
Let me conclude on valuation, since it's highlighted in several rows in the table above. On a forward earnings basis, you can see in the chart below that the market is still trading at a multiple below the long-term median.
Valuation still quite reasonable

Source: FactSet, Standard & Poor's, as of October 31, 2013.
Notice that valuation has never stopped at the median and immediately turned back down. In fact, the market doesn't spend much time at all at the median; instead it tends to well-overshoot on the upside in a bull market and to well-undershoot on the downside in a bear market (or when earnings growth exceeds market appreciation, like during 2009-2011).
In sum
As enthusiasm picks up for a bull market approaching its five-year anniversary, warnings about the risk of a melt-up are growing, and appropriate. But bubble-like conditions (think 2000) are not apparent. Although short-term measures of sentiment are stretched, valuation remains reasonable, the market's technical conditions are still healthy, and we are in the strongest seasonal period historically for stocks.