October 21, 2013
by Liz Ann Sonders, Senior Vice President, Chief Investment Strategist, Charles Schwab & Co., Inc.
Key Points
- A "great rotation" may not be underway by individual investors; even amid record-breaking outflows from bond funds this summer.
- But fund flow data do show some shift in preferences and highlight the sensitivity of investors to any rise in longer-term interest rates.
- A more interesting place to look is at the fiduciary community; that has decidedly shifted its attention away from traditional equities (and fixed income) over the past decade.
It's one of those catchy terms coined by a major Wall Street firm: the "Great Rotation," which describes the possibility of a major asset allocation shift by investors from bonds into stocks. Specifically, it circles around mutual fund flows and individual investors. It has perhaps been adopted as theme because it ties in nicely to the slowly fading memories of the "Great Recession."
The Great Rotation is typically described as retail investor money coming out of bonds/bond funds and going into equities/equity funds. In reality, investors don't ever really enter or exit an asset class. In the blog Philosophical Economics, it's argued that the exercise of calling it a Great Rotation is invalid given that for every seller there's a buyer: "Investors cannot leave or enter any asset class. All they can do is fight with each other over who will hold each asset class, offering to exchange money at various rates in exchange for the privilege of holding something else. The consequence of shifting preferences and exchange rates may be a destruction or creation of wealth in various places, but it is never a 'movement' of wealth."
The "destruction or creation of wealth" is worth discussing. According to several recent studies of investors, about two-thirds of US investors don't know how rising interest rates will impact investment portfolios. We received a dramatic insight into the mindset of investors during a sharp rise in longer-term interest rates this past summer. As you can see in the top field of the charts below, investors pulled a record amount out of bond funds in June, followed by continued outflows in each of the following two months (we won't have data for September until the end of this month).
Funds flows begin to reverse


Source: Investment Company Institute (ICI), as of August 31, 2013.
But as you can see in the longer-term chart in the bottom field above, there is a long way to go before there's even a noticeable dent in the trends that have been in place over the past five years. During that span, domestic bond funds saw their cumulative peak- at $1.166 trillion in May of this year- just prior to the record outflow month in June (followed by additional outflows in July and August). The net total for 2013 to-date for bond fund flows is an outflow of $13 billion. This was largely triggered by the move up in the 10-year Treasury yield from 1.66% on May 2 to 2.98% on September 5.
In turn, domestic equity fund outflows troughed at -$548 billion of outflows in December 2012; since which time outflows have dwindled amid three months of actual inflows. The net total for 2013 to-date for equity fund flows is an inflow of $15 billion.
What are the cohorts doing?
Which investors are rotating/could rotate out of bonds and what are the consequences of those moves? We can start by looking at the mutual funds themselves, whose actions tend to have the most effect in the short-term on markets. The latest survey by Bank of America Merrill Lynch covered 172 mutual fund managers managing over $500 billion in assets. It showed a 7½ -year low in bond positions relative to the funds' benchmarks. But the survey data shows that this money has not moved into equities- instead into cash- in which a growing number of funds are overweight.
That said, according to Investment Company Institute (ICI) data, the equity share of all mutual fund assets (excluding money market funds) was 65.7% at the end of 2012; which is below the 71% average of all comparable monthly readings since 1970.
Then there are the individual investors themselves. For most of those investors, asset allocation has been largely about safety, income and post-financial crisis peace of mind. For the older generation among this cohort, it's unlikely there will be a major rotation out of fixed income. Anecdotally, I hear consistently from Schwab's investors that they are looking to make adjustment within their fixed income allocation; not to exit from it. Since money market funds are often viewed as fixed income assets, money funds are likely the primary beneficiary of bond fund redemptions. This would especially be the case in a rising rate environment, which would make bond funds less attractive; but money funds more attractive.
Stepping back however, we can look at the relative positioning of stocks and bonds as a percentage of household financial assets. The former is now at about 38% (down from the 2000 high of about 53%; but up from its 2009 low of under 25%); while the latter is at 20% (up from its 2000 low of about 13%; but down from its 2010 high of over 23%). As you can see in the chart below, the ratio of the two began to rise at the stock market's low in 2009 and could have a lot more to go if past trends are a guide.
Equity exposure rising as share of assets

Source: Ned Davis Research, Inc., as of June 30, 2013. (Further distribution prohibited without prior permission. Copyright 2013© Ned Davis Research, Inc. All rights reserved.). Rising=% of assets in stocks rising relative to % of assets in bonds.
If this ratio does continue to increase, it's not likely to do so at a rapid clip (barring a late-1990s-like bubble-related melt-up in the stock market). Many domestic mutual funds are marketed and sold through asset allocation programs that incorporate automatic rebalancing triggers among stocks and bonds; as such, these "automatic stabilizers" can damp the notion of a "great rotation."
The cohort that may matter the most
There is a cohort of investors that could represent a more meaningful shift back toward traditional equity exposure. As has been documented in great detail by our friends at Strategas, it may be the fiduciary (public pensions/endowments/foundations) that may be the greatest source of a reallocation to equities. The source of those funds may come not from traditional fixed income, but from the "alternatives" space that had garnered so much attention over the past decade or so.
As Strategas has detailed, the "Yale Model" has been all the rage among the fiduciary cohort; which focuses on broad diversification and an equity orientation in different forms. The model holds that liquidity is extraordinarily expensive to purchase and that a greater exposure to asset classes like private equity will boost returns. The problem has been serial underperformance relative to traditional equities and/or actuarial assumptions of these plans.
As you can see in the table below, while traditional equity (and fixed income) exposure has plunged as a percentage of these plans' allocations; the action has been concentrated in alternatives. It is reported that Yale's public equity exposure is only 5%, while Princeton's is only 7%. The problem isn't necessarily the allocation; but the cost associated with that allocation; given the much higher fees associated with many of the alternatives' sub-categories (like private equity and hedge funds).
| Endowments asset allocation (dollar-weighted average) | ||||
| Year | Equities | Fixed income | Alternative strategies |
Cash/other |
| 2002 2003 2004 2005 2006 2007 2008 2009 2010 2011 2012 |
50% 49% 51% 48% 48% 47% 40% 32% 31% 33% 31% |
23% 21% 17% 17% 15% 13% 13% 13% 12% 10% 11% |
24% 27% 28% 32% 35% 37% 46% 51% 52% 53% 54% |
2% 2% 4% 3% 2% 2% 1% 4% 5% 4% 4% |
Source: NACUBO (National Association of College and University Business Officers)-Commonfund Study of Endowments (2009-2012), NACUBO Endowment Study (2002-2008), Strategas Research Partners LLC.
My friend Jason Trennert at Strategas notes the following about meetings they've had with investment committees:
"…the opacity of investment vehicles like private equity is a large part of the appeal. The focus on risk-adjusted returns, especially since 2008, has prompted many volunteer boards to structure portfolios that are designed more to avoid embarrassment than maximize future returns. Private equity is a perfect asset class for those enamored of the commonly accepted fiction that accompanies illiquid investment with take-my-word-for-it valuations. Liquidity can seem an expensive abstraction until, of course, it isn't there, at which point it can become priceless. Are the high fees of these vehicles warranted when above-average private equity returns will always be dependent upon vibrant public markets? Ultimately we believe that a variety of fiduciaries will be forced back into public equities, perhaps especially here in the United States, if they have any hope of meeting their assumptions."
I have first-hand experience with this as well. I sit on the investment committee of my undergraduate alma mater and we have recently had many of these same discussions; with an eye toward increasing our traditional US equity exposure while looking to reduce the fees the endowment is paying for its alternatives asset class management.
Rolling returns sending message
For an analysis of the cost/benefit of various asset classes, let me conclude with the following rolling returns table, also courtesy of Strategas. Could standard publicly-traded equities become the next darling of the fiduciary community? Perhaps.
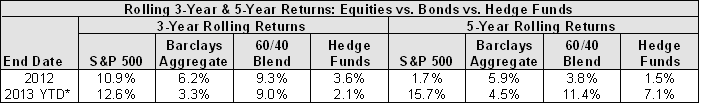
Source: Source: Strategas Research Partners LLC. *YTD through 9/30/2013; 3-Year and 5-Year trailing returns assume full year return for 2013. 60/40 blend calculated using a 60% weight to the S&P 500 to represent equities and 40% for the Barclays Aggregate to represent fixed income.