For the Equity Leaders Weekly this week, we are going to focus back in on the US Dollar Index Continuous Contract and we are also going to revisit Natural Gas as both of these contracts have had some recent changes.
US Dollar Index Continuous Contract (DX2.F)
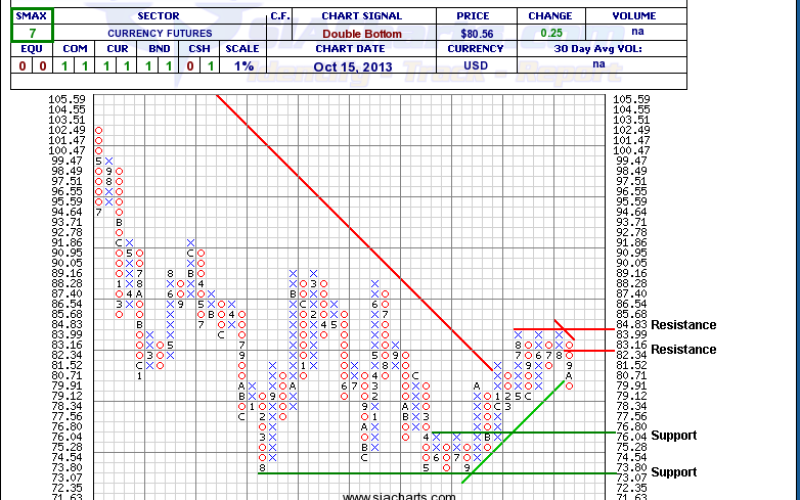
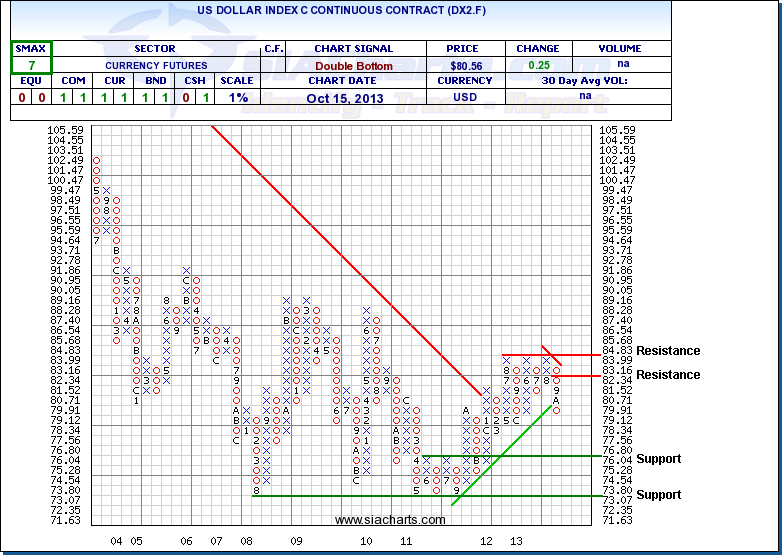
Since we last looked at the DX2.F back at the beginning of September, it has continued to pull back and has now violated the uptrend line that has been in place for the past 2 years. Further weakness could then correlate in a rise in Commodity prices which would be quite beneficial for the Canadian economy should that occur.
The next support level is now at 76.04 and again below that at 73.07, a level that has held 3 times in the past 5 years. Resistance is at 83.16 and again right above that at 84.83. With the SMAX still at 7, the DX2.F continues to show short term strength against the 5 asset classes, but has dropped slightly since our last update.
Click on Image to Enlarge
Natural Gas Continuous Contract (NG.F)
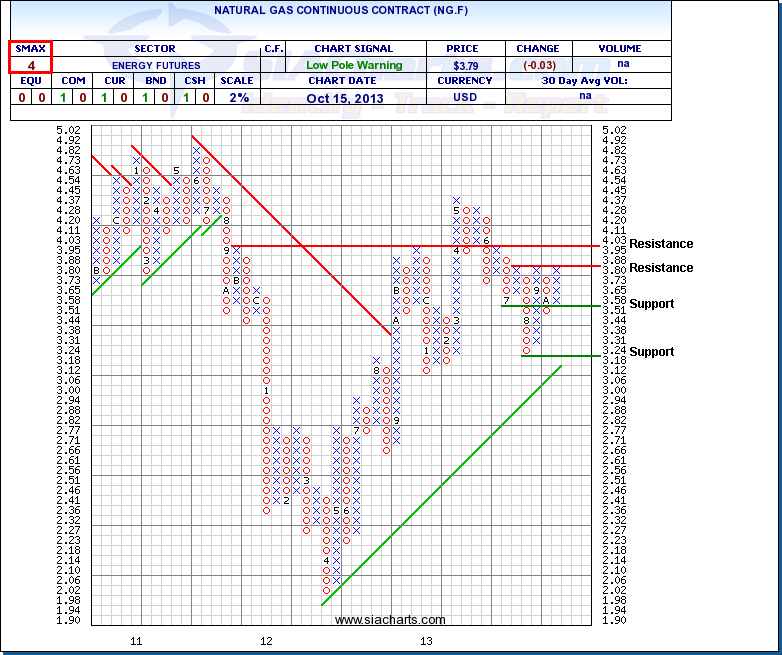
Having last looked at Natural Gas back in June of this year, we can see from the chart to the right that there has been a lot of up and down movement, with NG.F now up against a resistance level at $3.88 that it has hit 3 times in the past 3 months and failed to break. Should the third time be a charm, then the next resistance is quite close overhead, around the $4 level.
To the downside, support is now at $3.51 and again below that at $3.18, which will also correspond with the rising trendline that has been in place for the last year and a half.
With the SMAX at 4, NG.F is showing short term weakness against the asset classes and Commodities as a whole continue remain the weakest of the 7 asset classes in the SIA Asset Allocation Model.
Click on Image to Enlarge
SIACharts.com specifically represents that it does not give investment advice or advocate the purchase or sale of any security or investment. None of the information contained in this website or document constitutes an offer to sell or the solicitation of an offer to buy any security or other investment or an offer to provide investment services of any kind. Neither SIACharts.com (FundCharts Inc.) nor its third party content providers shall be liable for any errors, inaccuracies or delays in content, or for any actions taken in reliance thereon.


