Weekend Sentiment Summary (August Week 4)
Equities
- Last weeks sentiment update was not posted as I was tied up with other more urgent matters. I hope you enjoy this weeks in depth update and also stay on the look out for the new issue of the newsletter which will be out in coming days.
- AAII survey readings came in at 29% bulls and 43% bears. Bullish readings fell by 6% while bearish readings rose by a staggering 15%. The AAII bull ratio (4 week average) currently stands at 54%, which is quite a pullback in recent weeks. We are now in the middle of the historical range for this indicator. For referencing, AAII bull ratio survey chart can been seen by clicking here, while AAII Cash Allocation survey chart can be seen by clicking clicking here.
- Investor Intelligence survey levels came in at 43% bulls and 22% bears. Bullish readings decreased by 4%, while bearish readings increased by 1%. II bull ratio has pulled back from the 70% plus readings which give a "sell signal", but the sentiment is no where near pessimistic to justify investors to buy. For referencing, II bull ratio survey chart can been seen by clicking here.
- NAAIM survey levels came in at 35% net long exposure, while the intensity fell to 25%. Fund managers have once again reduced their exposure dramatically, even though the stock market has not corrected a lot. For referencing, recent NAAIM survey chart can been seen by clicking here.
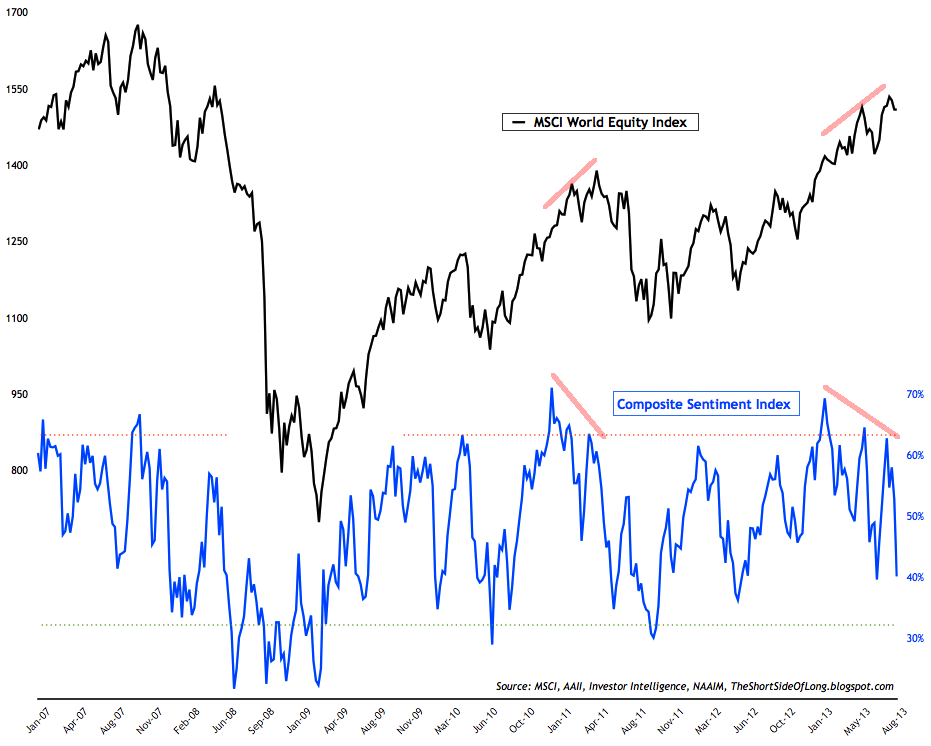
Chart 1: Stock market sentiment is once again diverging with the price
Source: Short Side of Long
- Other sentiment surveys have all pulled back from recent highs as well. Both the Consensus Inc survey and the Market Vane survey are diverging with the equity prices, just as is my own Composite Sentiment Indictor shown above. We saw a similar setup through the early parts of 2011, where equities rallied powerfully but sentiment surveys dropped off. Fall in sentiment did not help equity prices, as we experienced a crash by August 2011. We seem to be in another topping process now.
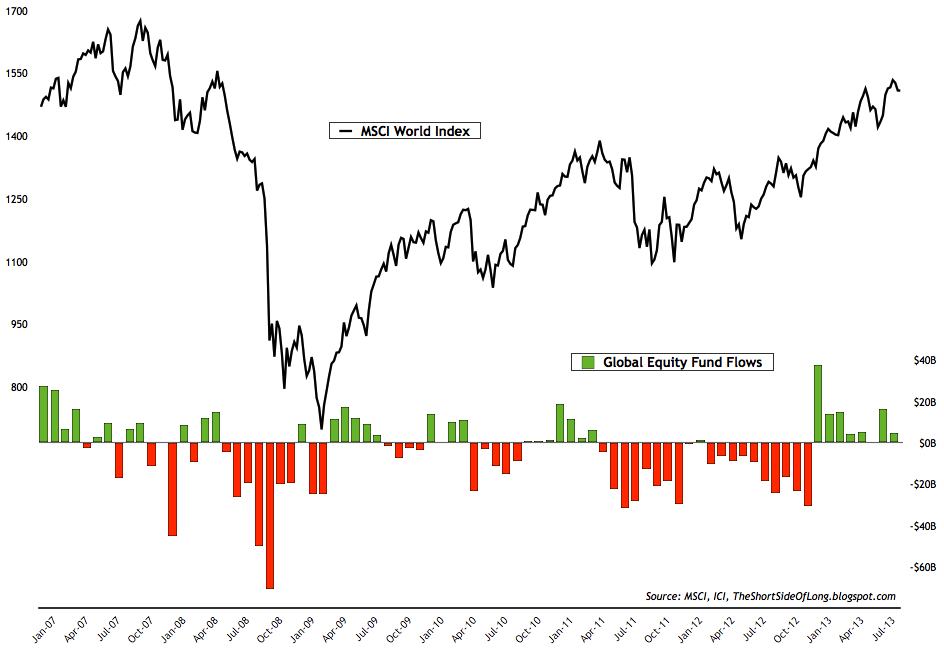
Chart 2: Another month, another stock inflow as money leaves bonds
Source: Short Side of Long
- Last weeks ICI fund flows report showed "equity funds had estimated inflows of $1.49 billion for the week, compared to estimated inflows of $3.41 billion in the previous week. Domestic equity funds had estimated outflows of $764 million, while estimated inflows to world equity funds were $2.26 billion." The chart above shows that retail investment community continues to pile into stocks. Rydex fund flows are also rising too. Recent data showed flow of funds indicator went from 0.24 towards 0.30 (bullish extreme is usually found around 0.37). For referencing, recent Rydex fund flow chart can be seen by clicking clicking here.
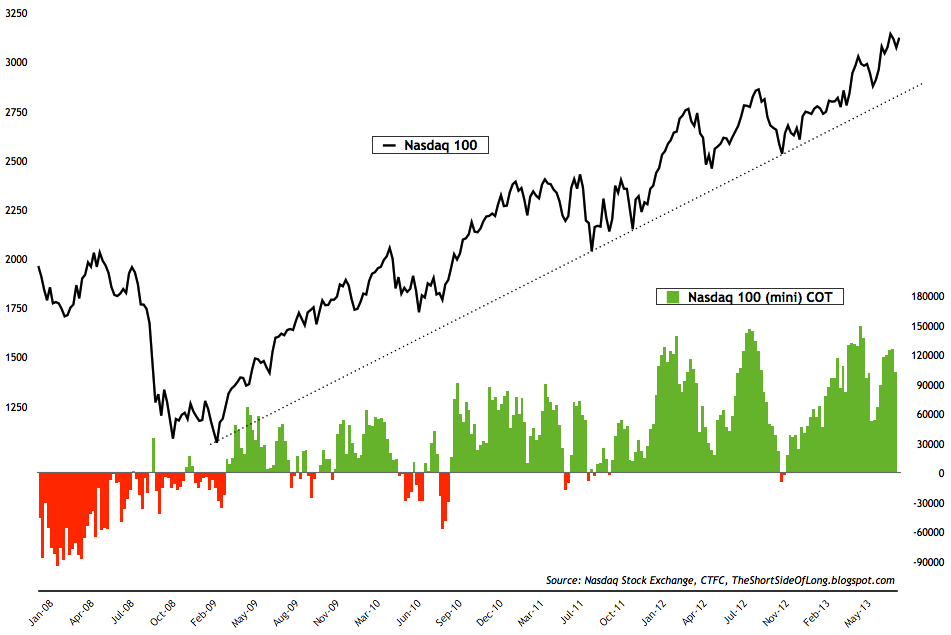
Chart 3: Hedge fund managers reduced net longs this week
Source: Short Side of Long
- Last weeks commitment of traders report showed that hedge funds and other speculators decreased their bullish bets for the first time in months. ,From the recent net long position of 124,500 contracts, we are now back to 102,000 net long contracts. Exposure remains very elevated but not at extreme levels, which is usually associated with market corrections.
Bonds
- Bond sentiment surveys have are not at or very near extreme pessimistic levels. Market Vane survey is at the lowest readings since early 2011 (last major intermediate degree bond bottom), while Consensus Inc survey is at extreme readings only witnessed a handful of times over the last decade and usually associated with buying opportunities. For referencing, recent Consensus Inc survey chart can be seen by clicking clicking here.
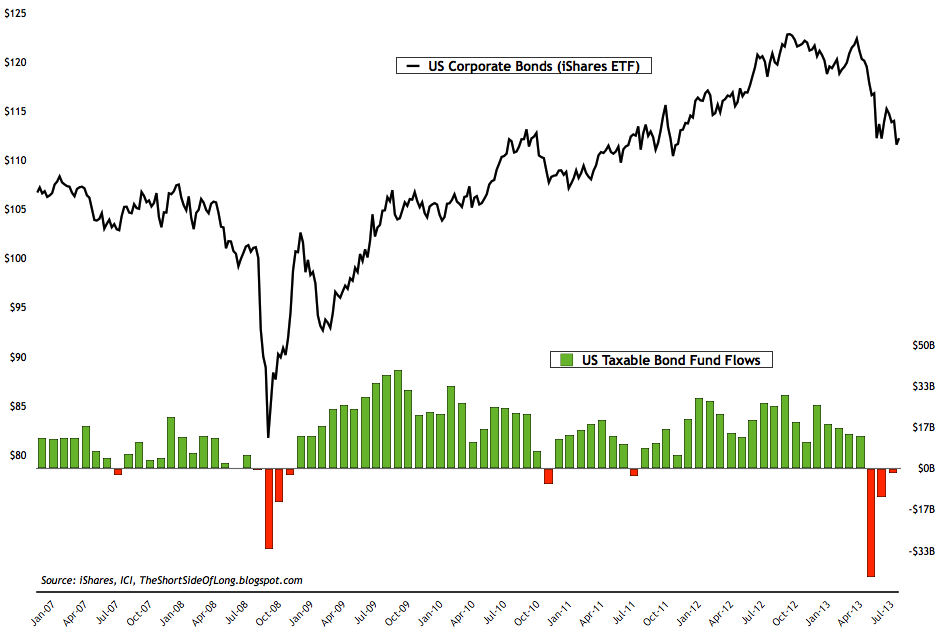
Chart 4: Bond fund outflows continue for the third month running
Source: Short Side of Long
- Last weeks ICI fund flows report showed "bond funds had estimated outflows of $3.92 billion, compared to estimated outflows of $2.09 billion during the previous week. Taxable bond funds saw estimated outflows of $1.84 billion, while municipal bond funds had estimated outflows of $2.09 billion." We are now experiencing a third monthly bond outflow in the row, as the retail investment community switches over from bonds into stocks.
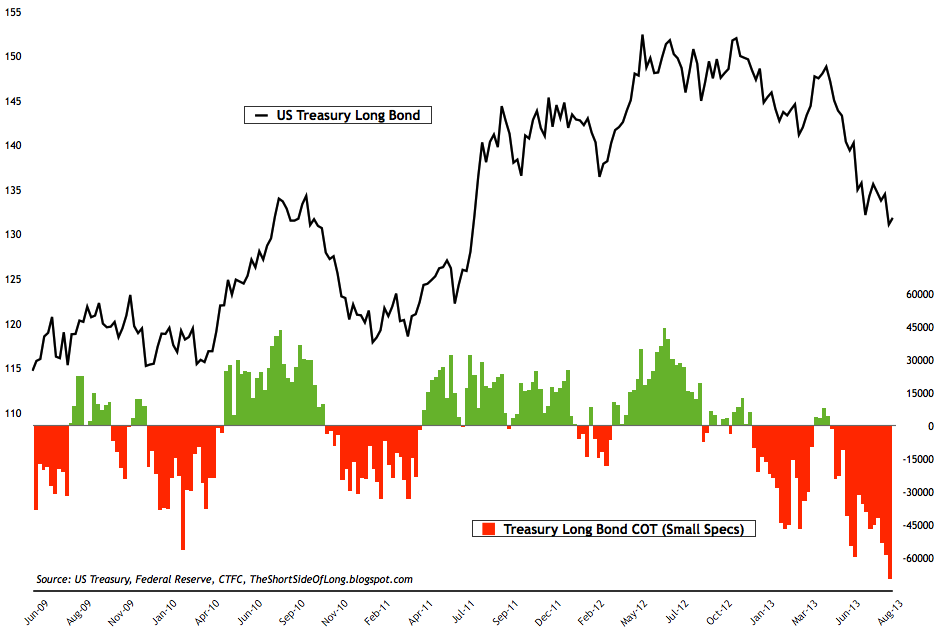
Chart 5: Traders hold one of the biggest short bond positions in years
Source: Short Side of Long
- Last weeks commitment of traders report shows that small speculators increased net short bets dramatically on the Treasury Long Bond. Current readings now stand at close to -70,000 net short contracts, which is one of the most negative positions in years.
Commodities
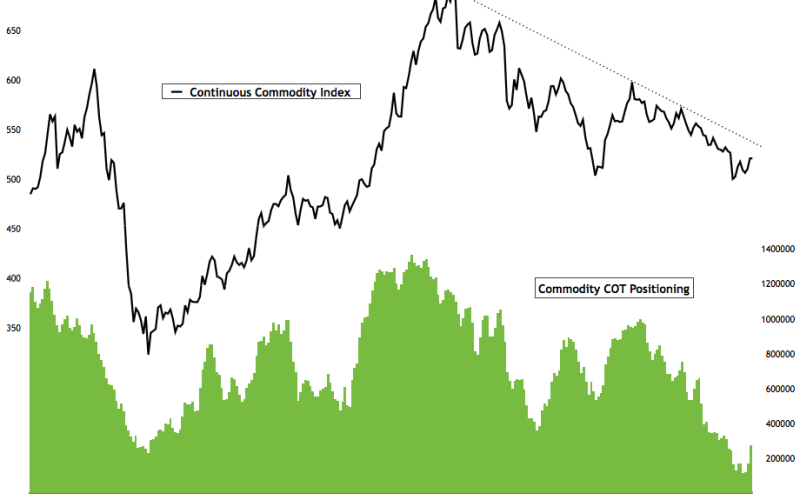
Chart 6: Fund managers have started adding exposure to commodities
Source: Short Side of Long
- Last weeks commitment of traders report showed that hedge funds and other speculators increased commodity exposure substantially for the first time in months. Cumulative net longs currently stand at 275,000 contracts (custom COT aggregate), however still remain at an extremely low nominal level compared to other intermediate bottoms.
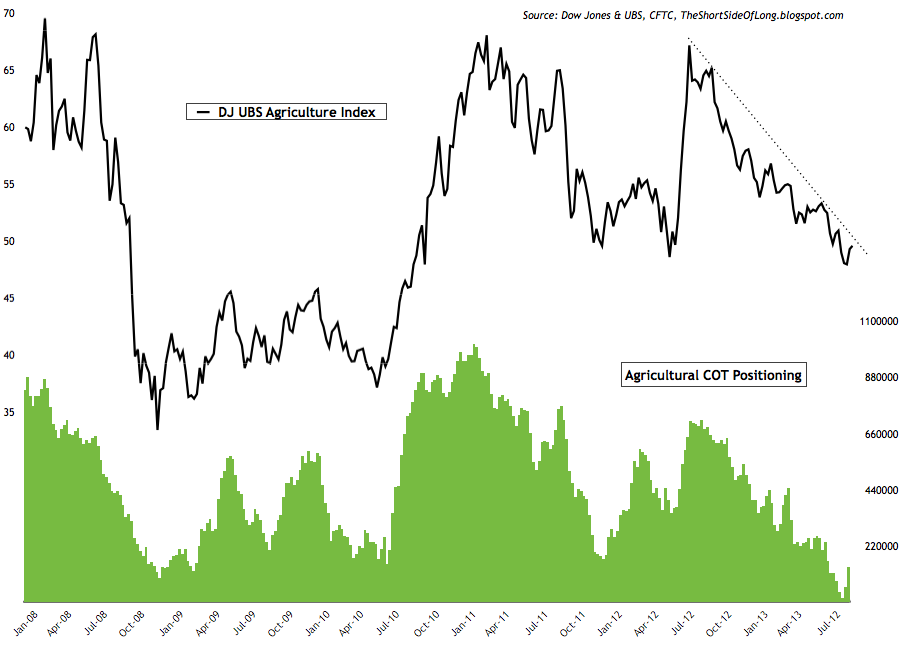
Chart 7: After months of selling, Ag net long positions are rising!
Source: Short Side of Long
- Exposure was increased in the agricultural sector for the third week running (chart above). However, technically the downtrend still remains in place when we glance at the chart of DJ UBS Agriculture ETF, so further buying will be necessary to push the price higher and break out. Agriculture remains one of the cheapest assets out there, with fundamentals improving.
- Commodity Public Opinion surveys remain mixed within the commodity complex. While there are a few commodities with negative sentiment, majority of the readings have now recovered to neutral or optimistic levels. It is only natural to see an uptick in sentiment as we experience an relief rally from oversold levels few weeks ago. For referencing, recent Sugar Public Opinion survey chart can be seen by clicking clicking here.
Currencies
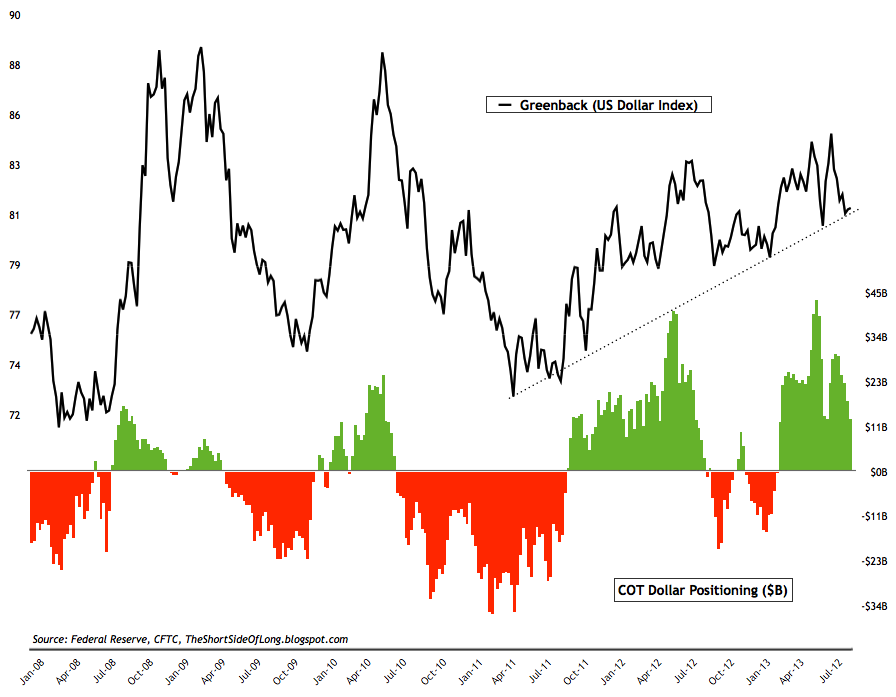
Chart 8: Hedge funds continue to slash US Dollar net long exposure
Source: Short Side of Long
- Last weeks commitment of traders report showed a another weekly reduction in net long exposure towards the US Dollar. Cumulative positioning by hedge funds and other speculators stands slightly higher than $13.2 billion. Investors should note that hedge funds now hold long positions on the Euro, Fran and Kiwi Dollar. Short exposure in the Aussie Dollar remains extremely high. Finally, technically we can see the Dollar testing its 2 year old uptrend line. Watch for buying interest to return.
- Currency Public Opinion survey readings on the US Dollar are now slowly approaching negative levels, but are not yet at extremes. At the same time, Public Opinion on the foreign currencies has rebounded from the pessimistic readings we saw a couple of months ago, as the prices rose. Sentiment on the Pound is actually approaching extreme bullish levels, so keep an eye out on this currency. Last time we saw this (August 2012), I successfully shorted the currency over 10 cents lower (link here).
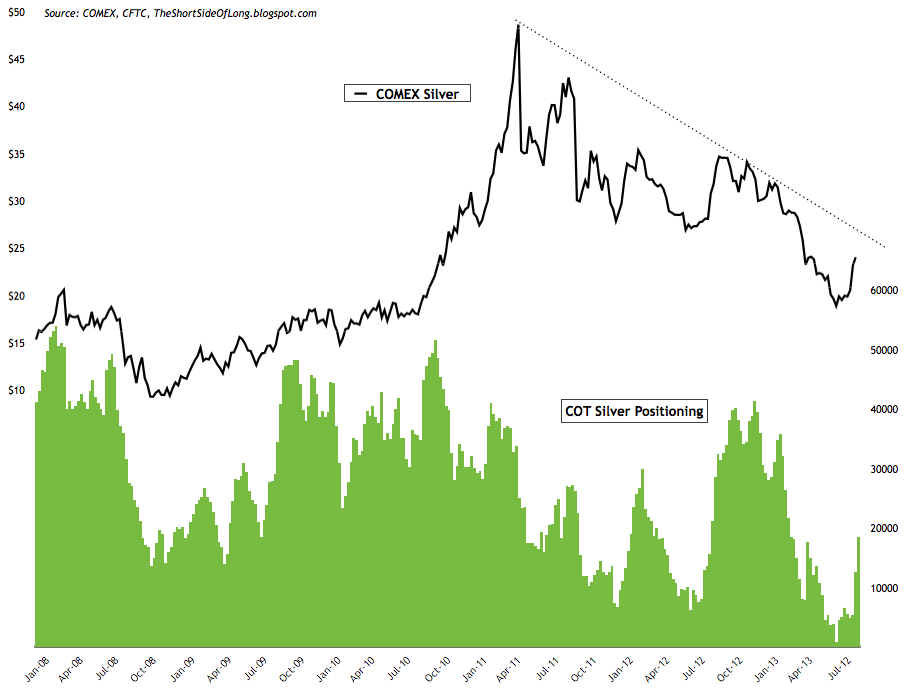
Chart 9: After shedding exposure for months, funds are now buying Silver
Source: Short Side of Long
- Last weeks commitment of traders report showed hedge funds and other speculators increased their net long exposure in the precious metals sector. Exposure currently stands at 60,400 net long contracts on Gold and 18,500 net long contracts on Silver. The chart above shows that Silver has rallied very powerfully over the last few weeks (from $19 to $24 in a couple weeks). Recent price action indicates a resistance around $26 (more on that below).
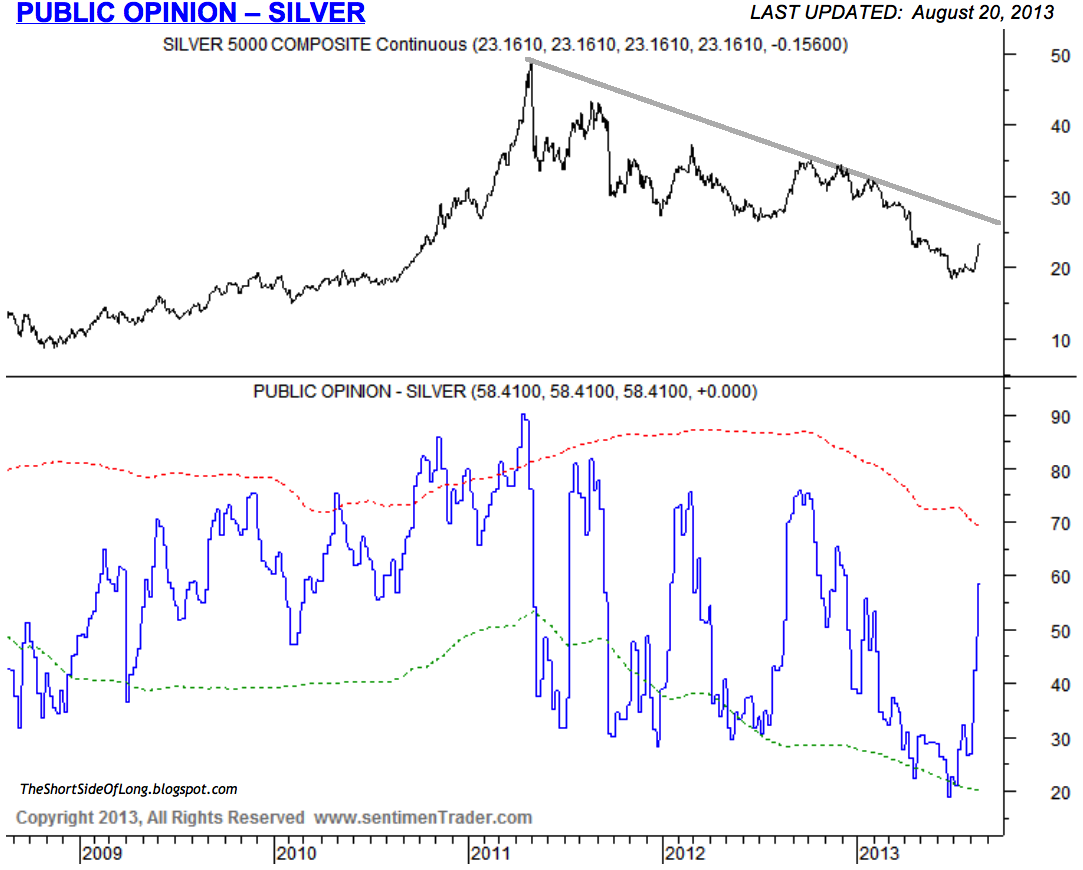
Chart 10: Traders are now turning more optimistic on the metal
Source: SentimenTrader (edited byShort Side of Long)
- Public opinion on alternative currencies like Gold and Silver has finally bounced from the depressed levels witnessed for weeks on end. While not at extreme levels just yet, sentiment has risen together with price as of late. Technically speaking, Silver has a polarity resistance at $26 (previous support) and a downtrend line around the same level. Look for this trend line to break before a new bull market starts.


