by Chris Marx, AllianceBernstein
By Chris Marx and Alison Martier
A reader of our recent blog post about stocks in rising-rate environments asked us for more details on the magnitude and timing of any stock-market sell-offs during those periods. They were uncommon but ugly, so we thought our answer warranted another post.
As we wrote earlier, global stocks averaged annualized gains of around 17% during the 15 periods of rising 10-year US Treasury yields, outperforming their long-term average pace by roughly eight percentage points. In nine of those periods, there were no major stock-market pullbacks, and price gains remained above the historical trend for the duration of the rising-yield cycle.
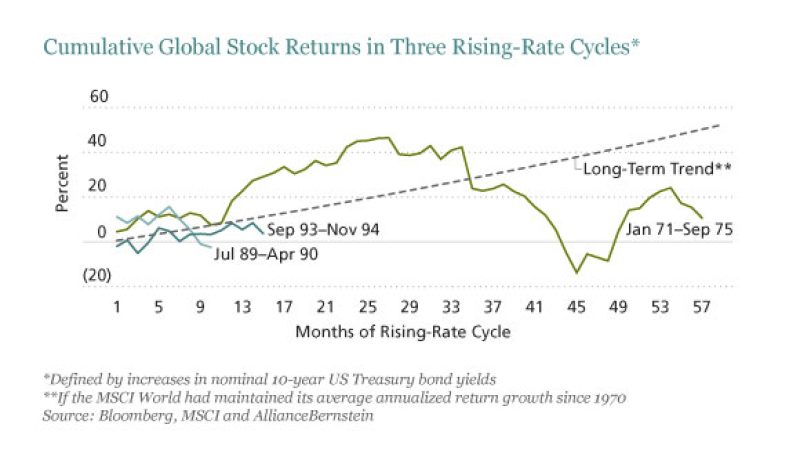
But how bad did it get when stocks didn’t do so well? The display below shows the cumulative global stock returns for three such periods. By far the worst sell-off occurred during the 1971–1975 rate rise (green line). Stocks climbed 27% in the first two-and-a-half years. Then came the OPEC oil embargo of October 1973, which caused widespread energy shortages and soaring headline inflation. Stocks plunged more than 40% in the subsequent 12 months before recovering. Although stocks rose 11% over the full rate upcycle, annualized gains significantly lagged their long-term average pace.

During the 1993–1994 episode (dark blue line), when the US Federal Reserve’s surprising tightening shift pushed 10-year US Treasury yields up 250 basis points in 15 months, stocks ended the rate upcycle only modestly higher. Upticks were interrupted by a couple of pullbacks of roughly 6%.
There was only one case in which stocks finished lower than where they began—during the 1989–1990 rate rise (light blue line), when the US savings-and-loan crisis caused massive bank failures and drove up risk premiums. Stocks trended upward for the first six months, then fell 16% during the remaining four. For the full rate upcycle, stocks were down 2.4%.
In two other periods (not shown), stocks tallied above-trend performances despite significant sell-offs along the way. Stocks dropped 14% in the final 10 months of the 1976–1981 rate rise, as then–Fed Chairman Paul Volker’s hardline anti-inflation campaign pushed the US into recession. There was also a 10% correction in the first few months of the 2002–2006 rising-rate cycle, as markets absorbed monetary-policy shifts.
So, apart from the 40% yearlong nosedive in the 1973–1974 bear market, stock-market drawdowns during periods of rising yields generally have been modest. As we indicated in our earlier post, with the US economic recovery still fragile and inflation quiescent, we see little reason to expect a repeat of the worst scenarios—barring any unforeseeable financial or geopolitical crises.
The views expressed herein do not constitute research, investment advice or trade recommendations and do not necessarily represent the views of all AllianceBernstein portfolio-management teams.
Chris Marx is Senior Portfolio Manager of Global Equities and Alison Martier is Senior Portfolio Manager of Fixed Income at AllianceBernstein.
Nelson Yu, Deputy Head of Quantitative Value Research, contributed to the research in this report.