by Seth J. Masters, AllianceBernstein
In July 2012, we argued that the Dow Jones Industrial Average would rise to 20,000 within a decade. At the time, the 20,000 Dow looked impossibly far off. With the market up over 20% since then, our forecast now seems less ambitious. What has changed over the past year? And what should we expect looking forward?
A year ago, many investors were worried about the fiscal cliff in the US, recession in Europe and a crash landing in China. While risks remain, the fiscal cliff was averted, and private-sector strength is blunting the impact of US federal budget sequestration. Europe appears to be emerging from recession. China’s slowdown is real, but to a pace most countries would find desirable.
Improving conditions drove the market upward. Stocks are no longer as cheap as a year ago. Valuations are now about in line with long-term averages. Bond yields, while rising, are still very low; stocks remain very attractively valued versus bonds.
The S&P 500 (a broader representation of US stocks than the Dow) was trading at only 14 times consensus earnings estimates for the next 12 months at the end of June, compared to over 25 times in March 2000 just before the tech bubble burst. In addition, companies now boast very strong balance sheets, with a net debt to equity ratio of 34%, far below the 63% of the October 2007 market peak. So even with the rally over the past year, US stocks are not overpriced or overleveraged, and remain more attractive than at prior peaks.
Secondly, interest rates have risen over the past year. While rates are no longer at all-time lows, they remain very low. We expect rates to gradually trend higher. But a slow rise in rates from current low levels is unlikely to derail our 20,000 Dow forecast.
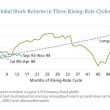
As my colleagues Chris Marx and Alison Martier explained in a recent article, the stock market has rallied in most historical periods of rising interest rates, as both the stock and bond markets priced in expectations of stronger economic growth. The exceptions were a few periods when inflation was getting out of control, most notably in the 1970s. History suggests that inflation below 5% or so is unlikely to be bad for stocks. And inflation for the time being remains very subdued.
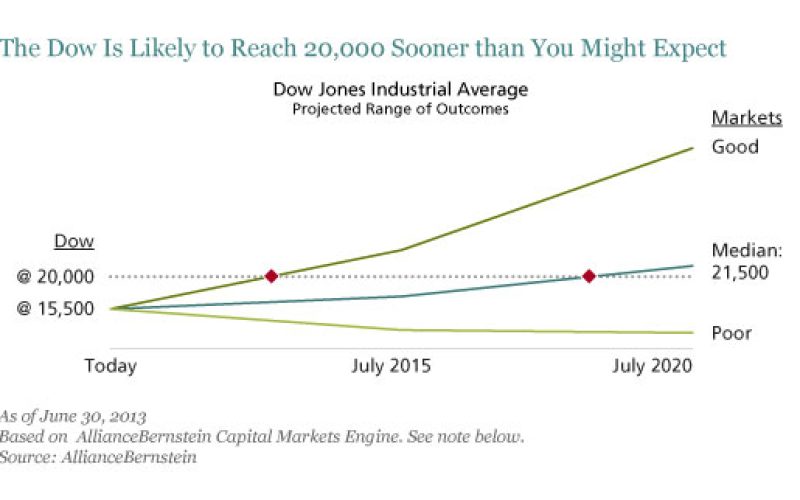
Based on current conditions, we now project that in median markets the Dow would reach 20,000 by late 2018, as the display below shows. We think that is a fairly modest target: less than a 30% gain over five years, perhaps with significant volatility along the way.

As always, our projected range of outcomes for stocks reflects thousands of plausible economic and capital market scenarios, some of them very grim. Persistent deflation or a sharp run-up in inflation, for example, could delay the Dow’s reaching 20,000 by many years, but we think the odds of either are slim. By the same token, if economic and earnings growth accelerates sharply, the market could roar ahead, possibly reaching our target as soon as late 2014.
In short, we think stocks still offer good return potential—especially compared to bonds—although with higher risk. Most investors with a long-term horizon should have a healthy allocation to stocks; in practice, many investors today have too little.
Of course, most investors also need the relative stability, income and diversification benefit that bonds can provide. We counsel investors to weigh the substantial risk of a large peak-to-trough loss from an equity-heavy portfolio against the substantial risk of running out of money from a bond-heavy portfolio, the shown in the second display, below.

For most investors, the best mix of growth and stability will be somewhere in between. The key is to find the right mix and stay with it, rather than becoming exuberant in strong markets and panicking in down markets.
The views expressed herein do not constitute research, investment advice or trade recommendations and do not necessarily represent the views of all AllianceBernstein portfolio-management teams.
The Bernstein Wealth Forecasting System, based on the Capital Markets Engine, uses a Monte Carlo model that simulates 10,000 plausible paths of return for each asset class and inflation rate and produces a probability distribution of outcomes. The model does not draw randomly from a set of historical returns to produce estimates for the future. Instead, the forecasts (1) are based on the building blocks of asset returns, such as inflation, yields, yield spreads, stock earnings and price multiples; (2) incorporate the linkages that exist among the returns of various asset classes; (3) take into account current market conditions at the beginning of the analysis; and (4) factor in a reasonable degree of randomness and unpredictability.
Seth J. Masters is Chief Investment Officer of Bernstein Global Wealth Management, a unit of AllianceBernstein, and Chief Investment Officer of Defined Contribution Investments and Asset Allocation at AllianceBernstein.