“The Philosophy of Tops”
by Jeffrey Saut, Chief Investment Strategist, Raymond James
July 15, 2013
“Everyone kept saying ‘a top is not in place yet.’ They persistently pointed to the ‘normally reached’ levels of this or that statistic that were not yet there to reinforce their desire to remain bullish. . . . Apart from statistical measures of increasing blindness, this unwillingness to acknowledge what they themselves were already feeling revealed a comfortableness, a confidence, a conviction that whatever was happening – short-term survivable dips – would continue . . . until ‘the top,’ like a strip tease artiste of our youth would with decorum appear on stage, bow, and then, accompanied by applause from all the bulls eager to cash in on their excitement, would begin to twirl its statistical tassels in front of everyone.
“I’ve gotten so old I can’t remember the names of those ladies at the Old Howard, but I can remember that all you got was a flash of this or that, before they waltzed off. Stock market tops are like that. You know it’s there somewhere if you squint hard enough, but you never quite see it, so you keep waiting for more. And then, in the end, as the curtain comes down on the bull market you realize that the one rule about tops is not that they provide this or that signal, but that they come before anyone is ready.”
. . . Justin Mamis
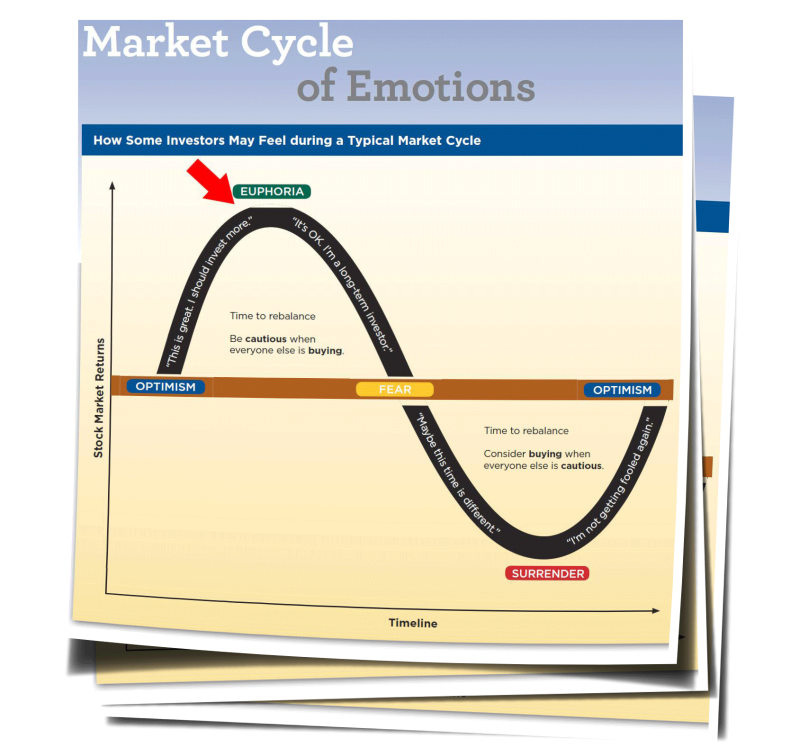
I have used this quote from Justin Mamis (historian, author, and stock market guru), many times during the years. I use it again this week since we have arrived at my major timing point of July 19th, which for months I have suggested represents the best potential for the first meaningful decline of the year. Of particular interest is Justin’s last sentence, “They (read: tops) come before anyone is ready.” Currently, very few are actually ready for an intermediate “market top” given the consensus opinion the recent Dow Wow is the start of another leg to the upside. That bullish feeling is presented in a well-written article by technical analyst Michael Kahn in this week’s Barron’s whose title reads “The Rally Is for Real,” but with his bullish conclusions, at least on a short-term basis, I am in total disagreement. My analysis suggests the extremely oversold condition that spawned the recent rally has evaporated, leaving my proprietary indicators just about as overbought as they ever get. Take the NYSE McClellan Oscillator (see chart); it has traveled from the deeply oversold levels of June (minus 190), to last week’s high of +150. Indeed, the McClellan Oscillator is more overbought than it has been at any time over the trailing 12 months. In past missives I have discussed my various “timing points” (minor 7-11/12-13; major 7-19-13), and backed up those quantitative/technical timing points with a potential news backdrop supporting the rationale for a trading top including: the “Fed speak” of July 17/18th, weaker than expected earnings/revenues season, rumblings out of the D.C. Beltway about sequestration taking a “bite” out the economy accompanied by arguments about debt-ceilings and continuing resolutions, etc.
Adding validity to those timing points, as well as my news backdrop points, is this verbiage from the good folks at StockCharts.com (as paraphrased by me):
[The] S&P 500’s annualized return since 1950 [from] July 1st through July 17th is +21.48%; [but] from July 17th through September 28th its return is minus 2.04%. That July 17th – September 28th period has covered 3140 trading days, or roughly 12.4 years-worth of data. That's a lot of data and certainly should be considered a ‘representative sample’ by statisticians. And it trails the AVERAGE annual return of the S&P 500 by more than 10 percentage points. Based on these FACTS, there is no doubt the market has an historical ‘tendency’ (not a guarantee) to struggle throughout this period, some years much worse than others.Obviously I agree with the astute StockCharts.com organization, which why I counseled investors to “raise cash” last week on a short/intermediate-trading basis. Longer term, I still think the envisioned decline should be used as a “buying opportunity” because I think the odds we are into a new secular bull market remain “high.” Yet, very few investors believe it. As often stated, most investors think you have to have a feel good environment to experience a bull market; but when you have that “feel good” environment, you tend to be in the late innings of that bull market (remember 1998 – 1999?). Manifestly, the equity markets do not care about the absolutes of good or bad, but whether things are getting better or worse.
As for all the questions I got about my statement in last Thursday’s Morning Tack – “I’m still looking for a ‘blue heat,’ upside double-top blow off” – it’s kind of like pornography, you’ll know it when you see it. Obviously, “blue heat” is a reference for a sharp rally (we got a hint of that with last Thursday’s action). Double-top implies just that, another “print” by the S&P 500 (SPX/1680.19) slightly above/below the May 22nd intraday high of 1687.18. The ideal pattern would be for the SPX to pop above 1700 and get everyone excited about another leg to the upside just in time to trap the newly committed cash with an ensuing decline. As for the term “blow off,” this represents a large and dramatic price movement that is generally seen at inflection points in the stock indices, or on individual stocks. Go back and look at the SPX’s pricing action in March 2009 if you want to see a downside “blow off.” Then turn that chart upside down and you will see what an upside “blow off” looks like. It looks remarkably similar to what we are currently experiencing. In any event, this week or next, we are about to find out if my timing models will continue to work as well as they have been working.
And then there was this from Duncan Parker (duncan.a.parker@gmail.com), a Minyanville contributor:
“I've been a vocal (probably obnoxiously vocal) doubter of the Russell 2000 for the last two weeks. I've also been very wrong! A longer-term perspective presents iShares Russell 2000 (IWM/102.68) has ‘Pinocchio'd’ above upward channel resistance - although it did not close above resistance today (Friday, July 12th) and put in a rather bearish ‘hanging man’ candle, this hasn't mattered to Mr. Market. Relative Strength is the market's equivalent of unconditional love, it trumps all. You'll notice my Elliot Wave count isn't implying this rally is over, far from it actually. We're in the final days of establishing eWave 3, the longest and most powerful Elliot Wave. Due to having poked through upper resistance, we're likely to attempt a tag of the parallel upper trend channel in the coming week, although I think we'll come just shy (I see 106 as the top). The implied 25% decline from highs to around $79 (previous major resistance - now support) will come fast and without much warning. At this point I cannot foresee a catalyst that would cause such a severe sell off. By approximating the angle of decent from eWave 1 to eWave 2 I'm assuming an upward turning-point and tag of the bottom trend-line support this coming September. Should support hold, I believe we will see a true ‘face-ripping’ 11 month rally that will take IWM to new highs near $120 (see chart).”
While I don’t envision anything like Duncan’s 25% decline, his work reinforces Stockcharts.com’s work, as well as mine, in that there is a confluence of many “things” centering on this week and next that represent a potential turning point for the equity markets. After the type of “buying stampede” we have had, I have a difficult time believing my timing points represent a turn to the upside.
The call for this week: Raise cash . . .