The Instability of Stability
by Scott Minerd, CIO, Guggenheim Partners LLC
Hyman Minsky’s scholarship holds valuable lessons for the current dynamic in the economy. The Fed, via QE, continues to induce speculative buying in the Treasury market, which is having the effect of destabilizing a number of asset classes.
Economic stability, according to post-Keynesian economist Hyman Minsky, encourages more risk taking and higher leverage -- ultimately causing speculative bubbles and painful recessions. Government intervention designed to stabilize or stimulate the economy, such as quantitative easing (QE), is destabilizing when it gives markets a false sense of confidence. When false confidence is high, Minsky noted, markets become dominated by Ponzi buying -- when investors ignore fundamental asset values and nevertheless borrow to buy, based purely on the belief they can sell assets for more tomorrow than they paid today.
The U.S. Treasuries market could now be described as a Ponzi market. The only reason investors would buy Treasuries today is that they expect the Federal Reserve will buy them at higher prices in the future. This reasoning will come unstuck, however, once the Fed curtails its asset purchase program. We do not know when the Fed will taper QE, but the longer its expansionary policy continues, the more volatility-inducing pressure will build. That means stock and bond markets appear to be in for a rough ride over the next six months or so.
Economic Data Releases
Good Enough Payroll Number Likely to Keep QE on Pace
- Non-farm payrolls rose 175,000 in May, better than forecast and an improvement over April’s revised 149,000.
- Average hourly earnings and weekly hours were flat during May.
- The unemployment rate ticked up to 7.6%, due to an increasing labor force.
- Initial jobless claims for the week ended June 1st fell to 346,000 from 357,000.
- The ISM non-manufacturing composite rebounded in May, rising to 53.7 after falling for two months.
- The NFIB small business optimism survey rose to 94.4 in May, the best reading in one year.
- Factory orders increased less than expected in April, up 1.0%.
Eurozone Retail Sales Disappoint, but Encouraging Signs Elsewhere, Weaker Chinese Data
- Eurozone retail sales fell for a third straight month in April, down 0.5%.
- Eurozone GDP shrank 0.2% in the first quarter according to the second estimate, the sixth straight quarter of contraction.
- Industrial production in Germany jumped 1.8% in April, returning to positive annual growth for the first time in over a year.
- German exports surged 1.9% in April, the best result in 11 months.
- German factory orders fell more than the expected 2.3% in April, after increasing the previous two months.
- French industrial production jumped 2.2% in April, the largest monthly gain since August 2009.
- Italy’s first quarter GDP growth was revised down to -0.6%, the seventh straight quarter of contraction.
- U.K. industrial production increased for a third straight month, up 0.1% during April.
- Industrial production in China was lower than expected for the month of May, with 9.2% year-over-year vs. 9.4% expected.
- Retail sales growth in China ticked up to 12.9% in May from 12.8% in April.
- Chinese exports plummeted to 1.0% year-over-year growth in May amid a crackdown on fake trade invoices.
- Japan’s first quarter GDP was revised up to 4.1% annualized growth, the best quarter since 2011.
Chart of the Week
Economic Fundamentals Suggest Higher Yield
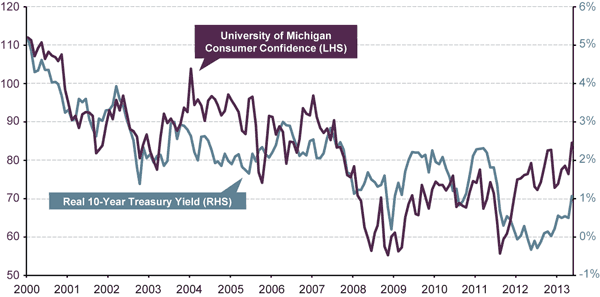
Historically, the real yield on 10-year Treasuries has closely tracked the University of Michigan Consumer Sentiment Index. The correlation broke down, however, in 4Q2011, as a result of the Federal Reserve’s asset purchase program. The yield on 10-year Treasuries would be roughly 150 basis points higher than it is today if the market was not being distorted by Ponzi (uneconomic) buying.
UNIVERSITY OF MICHIGAN CONSUMER CONFIDENCE VS. REAL 10-YEAR TREASURY YIELD*

Source: Bloomberg, Haver Analytics, Guggenheim Investments. Data as of 5/31/2013. *Note: Real 10-year yield calculated by using nominal 10-year yield and core PCE inflation.
This article is distributed for informational purposes only and should not be considered as investing advice or a recommendation of any particular security, strategy or investment product. This article contains opinions of the author but not necessarily those of Guggenheim Partners or its subsidiaries. The author’s opinions are subject to change without notice. Forward looking statements, estimates, and certain information contained herein are based upon proprietary and non-proprietary research and other sources. Information contained herein has been obtained from sources believed to be reliable, but are not assured as to accuracy. No part of this article may be reproduced in any form, or referred to in any other publication, without express written permission of Guggenheim Partners, LLC. ©2013, Guggenheim Partners. Past performance is not indicative of future results. There is neither representation nor warranty as to the current accuracy of, nor liability for, decisions based on such information.
Copyright © Guggenheim Partners LLC


