Upcoming US Events for Today:
• ADP Employment Report for January will be released at 8:15am. The market expects 172K versus 215K previous.
• Preliminary GDP for the Fourth Quarter will be released at 8:30am. The market expects a quarter-over-quarter change of 1.0% versus 3.1% previous. The GDP Price Index is expected to increase by 1.7% versus an increase of 2.7% previous.
• Weekly Crude Inventories will be released at 10:30am.
• The FOMC Rate Decision will be released at 2:15pm.
Upcoming International Events for Today:
• Spain GDP for the Fourth Quarter will be released at 3:00am EST. The market expects a year-over-year decline of 1.7% versus a decline of 1.6% previous.
• Euro-Zone Economic Sentiment for January will be released at 5:00am EST. The market expects 88.3 versus 87.0 previous.
• The Reserve Bank of New Zealand Rate Decision will be released at 3:00pm EST.
• Japan PMI Manufacturing for January will be released at 6:15pm EST.
• Japan Industrial Production for December will be released at 6:50pm EST. The market expects a month-over-month increase of 4.1% versus a decline of 1.7% previous.
The Markets
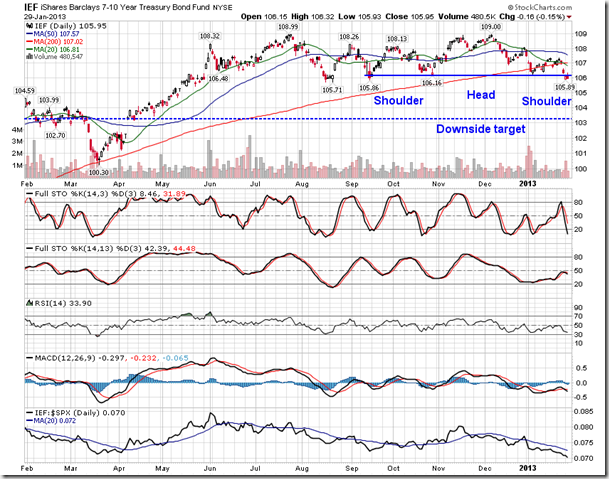
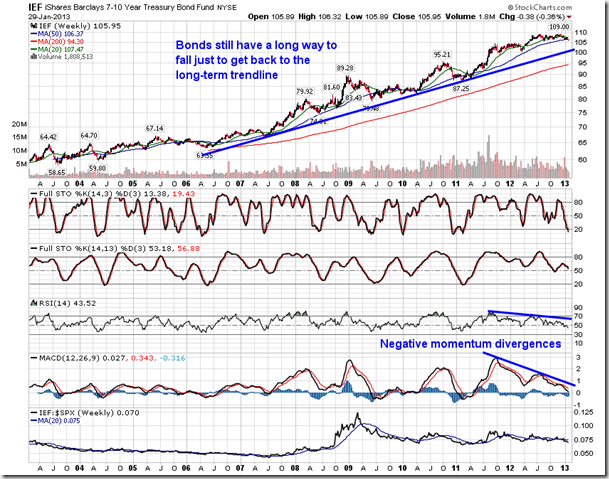
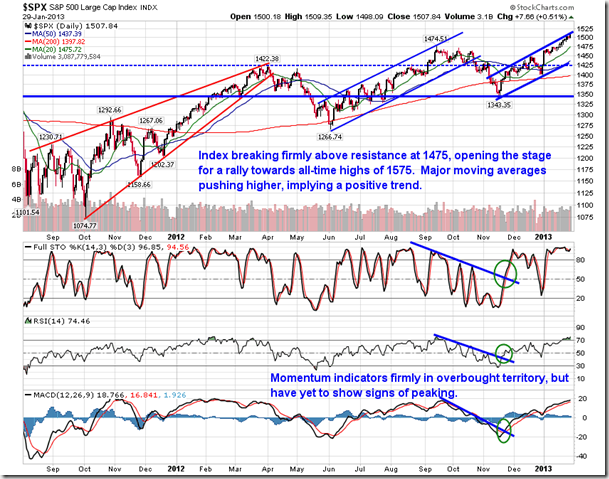
Equity markets continued to show resilience on Tuesday, adding to the strong gains that have pushed benchmarks to new recovery highs. The Dow Jones Industrial Average is now a mere 1.7% off of the all-time high of 14,198.10, while the S&P 500 has another 4.5% to go until the high of 1576.09 is surpassed. The rotation from bonds into stocks continues as the fixed income market shows significant indications of unwinding after a multi-decade bull run. Yesterday we highlighted the head-and-shoulders topping pattern in the 7 – 10 year Treasury Bond Fund (IEF), which is suggesting a decline of around 3% from present levels. Looking at the weekly chart of the same ETF, the bond market still has a long way to fall just to get back to the long-term trendline that has remained intact over the last seven years. It would only take a fraction of these assets that are flowing out of the bond market to come into stocks in order to continue influencing stocks higher.
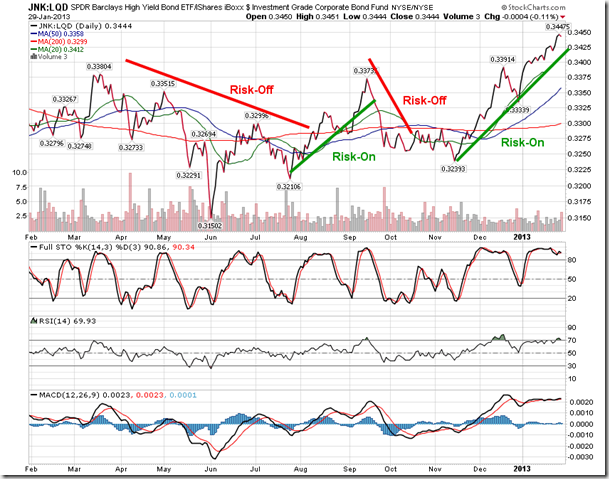
And within the bond market, investors are flocking toward the higher yielding (riskier) investments, liquidating the low yielding safe-havens, which acted as a hiding place throughout the extreme fundamental uncertainties over the past few years. As long as this risk-on trade continues, equity market strength can be implied.
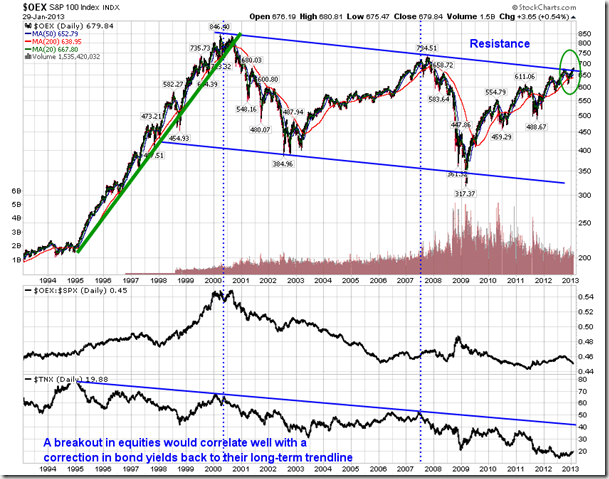
If you recall, a while back we presented a long-term chart of the S&P 100 index, the constituents of which “tend to be the largest and most established companies in the S&P 500”, according to Wikipedia. It should go without saying that this benchmark would present a reasonable proxy of the economy, or rather investors expectations of it. For over ten years the benchmark has been consolidating following the substantial five year run from 1995 to 2000. Early indications of a breakout from this pattern are starting to be realized as the benchmark pushes above long-term resistance presented by the declining trendline. It continues to remain possible that the over decade-long consolidation is part of a bull flag pattern, with the activity prior to 2000 acting as the pole and the flag portion resulting thereafter. This bullish setup could imply substantial upside still remains, assuming the breakout does not fail. The breakout in equity prices would correlate well with a correction of bond yields back to their long-term trendline.
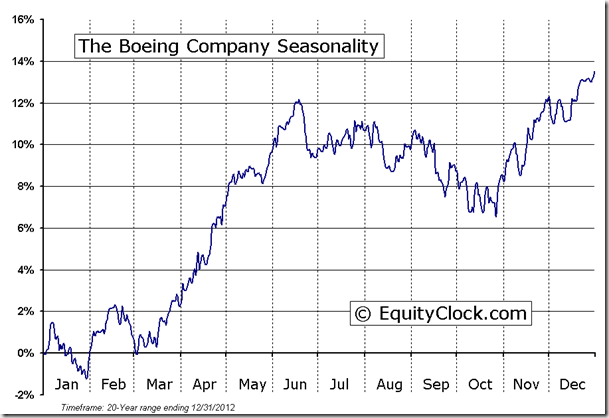
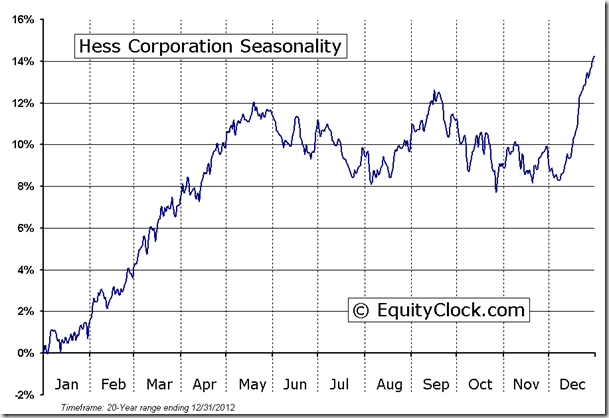
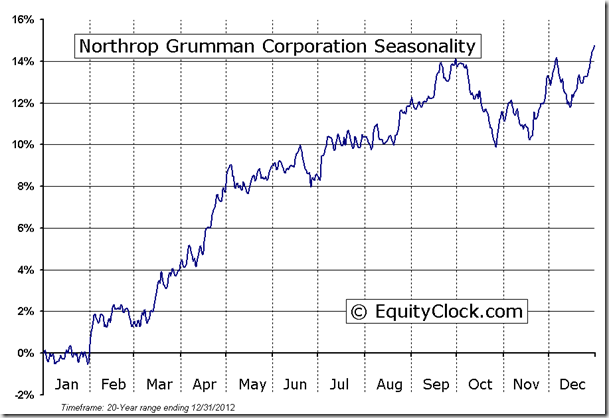
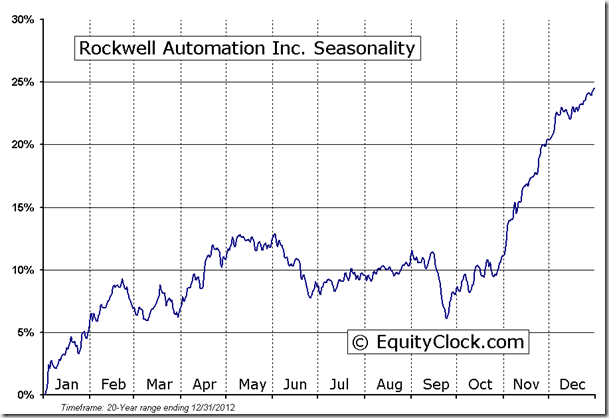
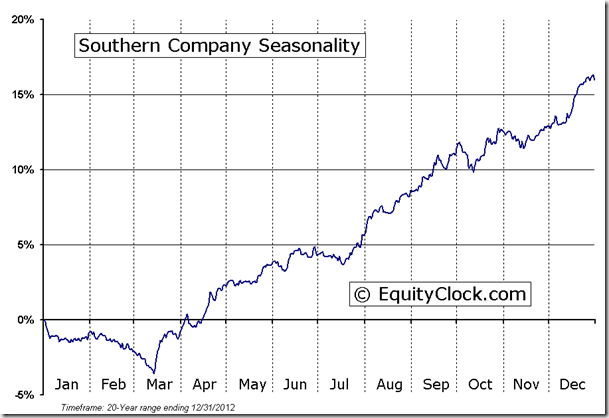
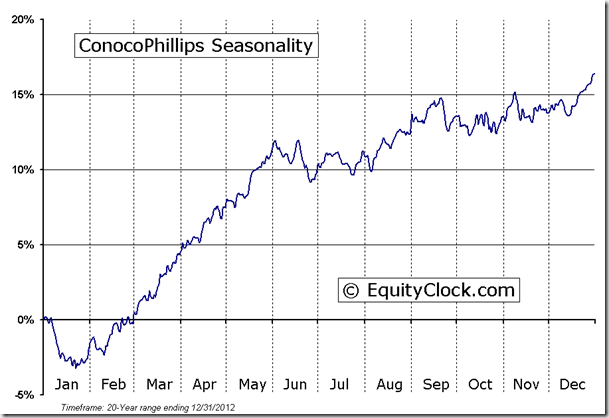
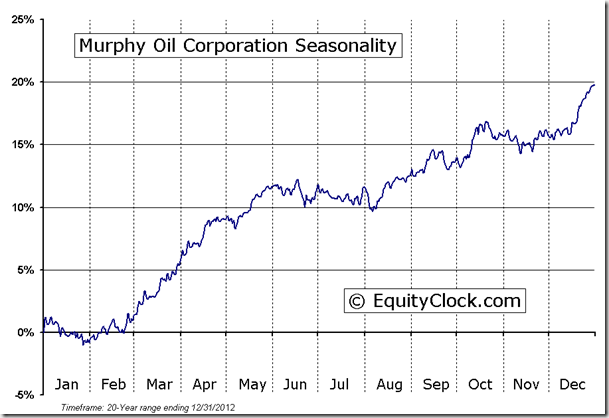
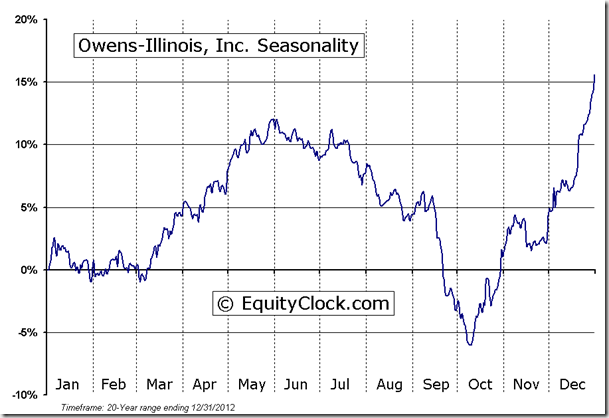
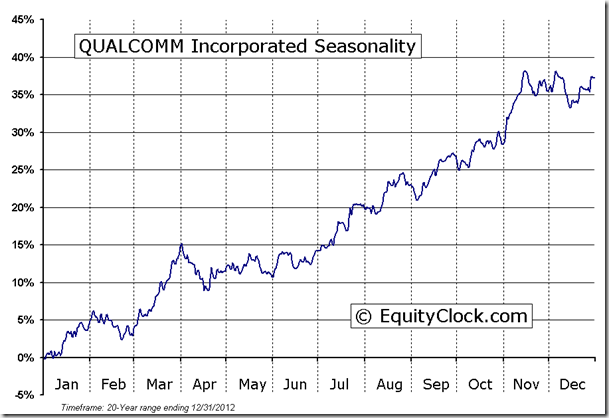
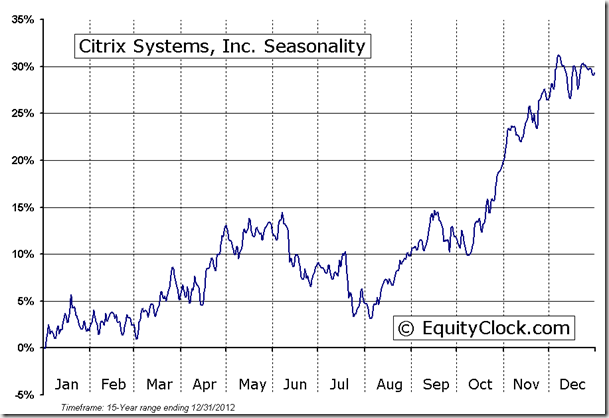
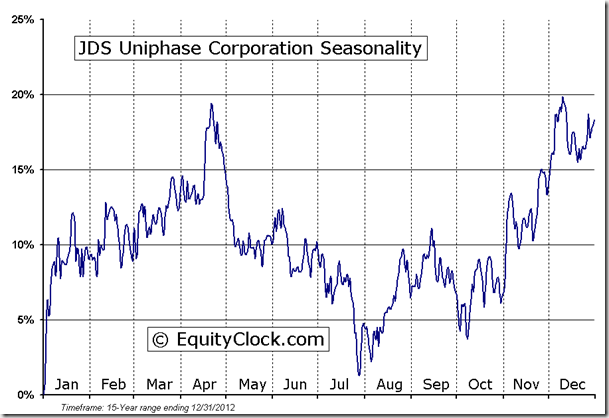
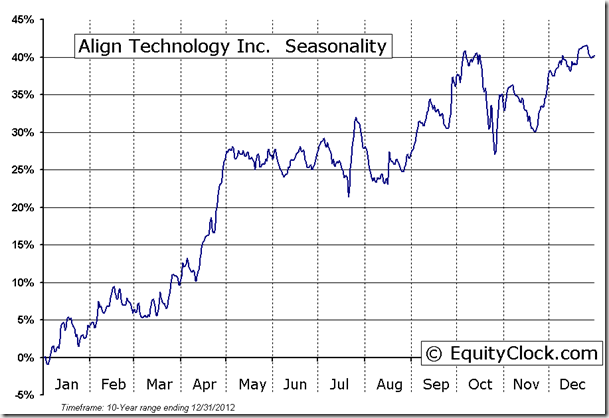
Earnings season continues today with Boeing, Hess, Marathon Petroleum, Northrop Grumman, Rockwell Automation, Southern Co., Align Technology, Ameriprise Financial, Citrix Systems, ConocoPhillips, Facebook, JDS Uniphase, Las Vegas Sands, Murphy Oil, Owens-Illinois, and Qualcomm.
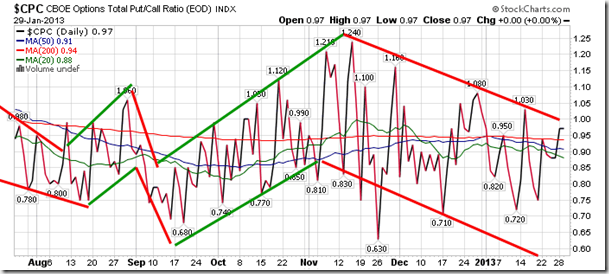
Sentiment on Tuesday, as gauged by the put-call ratio, ended unchanged from the day prior at 0.97.
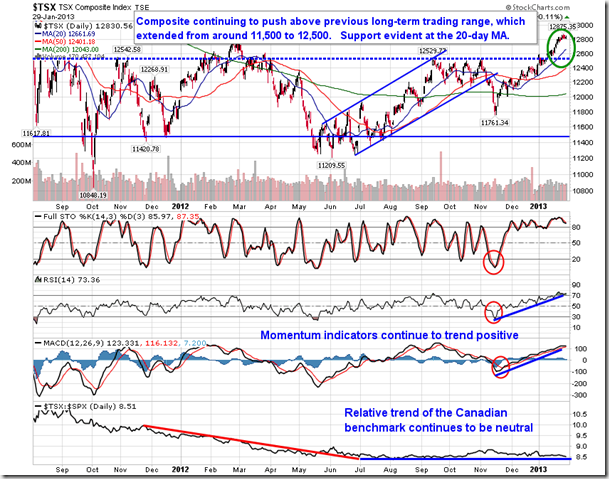
Chart Courtesy of StockCharts.com
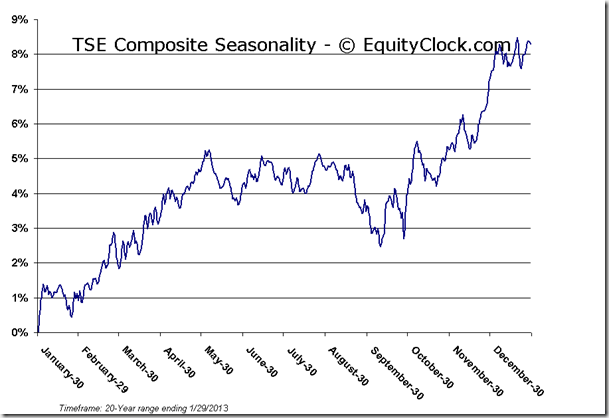
Chart Courtesy of StockCharts.com
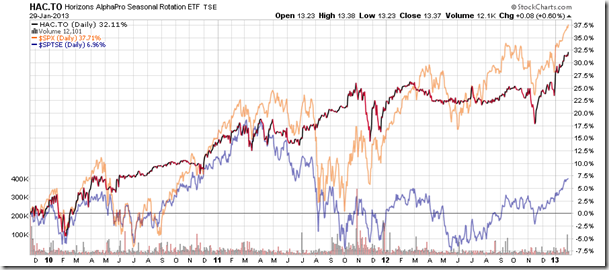
Horizons Seasonal Rotation ETF (TSX:HAC)
- Closing Market Value: $13.37 (up 0.60%)
- Closing NAV/Unit: $13.34 (up 0.43%)
Performance*
| 2013 Year-to-Date | Since Inception (Nov 19, 2009) | |
| HAC.TO | 4.91% | 33.4% |
* performance calculated on Closing NAV/Unit as provided by custodian
Click Here to learn more about the proprietary, seasonal rotation investment strategy developed by research analysts Don Vialoux, Brooke Thackray, and Jon Vialoux.


