by Don Vialoux, TechTalk
Editor’s Note: Don Vialoux is scheduled to appear on BNN Television at 4:50 PM EST on Monday)
Pre-opening Comments for Friday January 25th
U.S. equity index futures are higher this morning. S&P 500 futures are up 5 points in pre-opening trade. Index futures are responding to higher than consensus fourth quarter results by Starbucks, Halliburton, Procter & Gamble, Kimberly Clark, KLA Tencor and TempurPedic.
Other companies to report fourth quarter results included AT&T, Microsoft, Juniper, ETrade, Samsung, Honeywell and Hasbro.
Canada’s December Consumer Prices were significantly lower than expected. Consensus was a decline of 0.2% from November. Actual was a decline of 0.6%. On a year-over year basis, Canada’s Consumer Price Index increased 0.8%.The Canadian Dollar dropped 0.45 cents U.S. on the news.
Goldman Sachs slipped $0.80 to $144.16 after Citigroup and Deutsche Bank downgraded the stock from Buy to Hold.
Ford eased $0.01 to $13.86 after Barclays downgraded the stock from Overweight to Equal Weight.
Canadian Pacific dropped $0.40 to $112.67 after Canaccord downgraded the stock from Hold to Sell.
JP Morgan added $0.54 to $46.91 after Deutsche Bank upgraded the stock from Hold to Buy.
Oracle (ORCL $34.94) is expected to open lower after Goldman Sachs downgraded the stock from Conviction Buy to Buy.
Amgen added $0.71 to $83.33 after Argus upgraded the stock from Hold to Buy.
EBay improved $0.71 to $55.90 after Susquehanna initiated coverage with a positive rating.
Rentech Nitrogen, Agrium and CF Industries are expected to open higher after Dahlman Rose upgraded them from Hold to Buy based on improving nitrogen pricing.
Technical Watch
Halliburton Co. (NYSE:HAL) – $39.59 added 4.7% after reporting higher than consensus fourth quarter results. The stock has a positive technical profile. Intermediate trend is up. The stock broke above resistance at $37.90 on Wednesday and is expected to break above resistance at $38.76 at the opening to reach a 14 month high. Next resistance at $39.88 is about to be broken. The stock has formed a massive reverse head and shoulders pattern. The stock remains above its 20, 50 and 200 day moving averages. Strength relative to the S&P 500 Index has been positive since mid-November. Short term momentum indicators are overbought. Seasonal influences have just turned positive for a move into May. Preferred strategy is to accumulate the stock at current or lower prices.
Interesting Charts
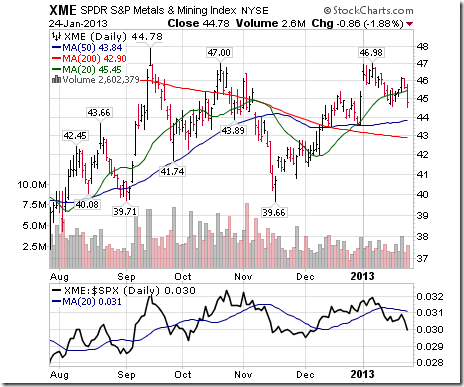
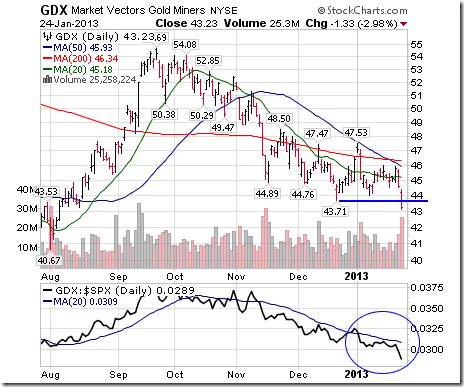
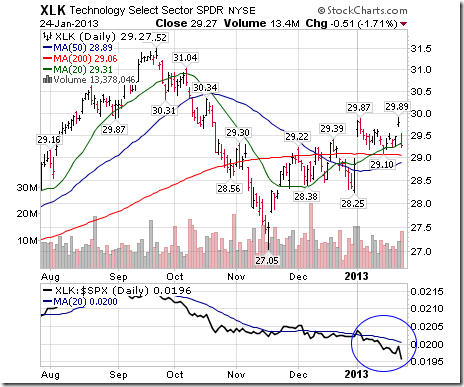
Despite major U.S. equity indices closing at new highs (Dow Industrials, Dow Transports, Russell 2000, S&P 500), selected sectors are struggling on a real and relative basis.
Gold equities are leading the Mines and Metals sector on the downside.
The Technology sector also is leading on the downside thanks mainly to weakness in Apple.
Updates on Sector Season Trades
Seasonal trades preferably have a technical score of 3 based on (1) trending up, (2) trading above its 20 day moving average and (3) outperforming the market.
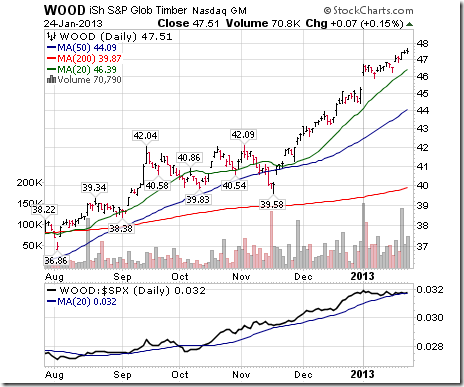
Technical score for the forest product equity ETF is 3.0. End of the period of seasonal strength is mid-February and (if extended) the first week in April.
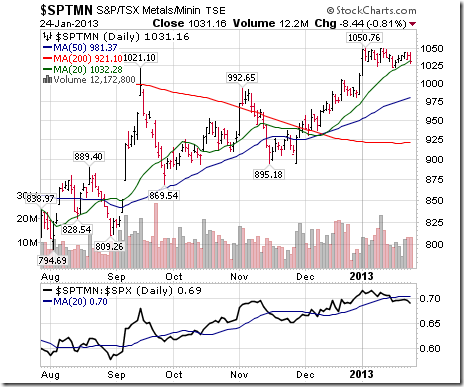
Technical score for the TSX Mines and Metals sector fell from 1.0 to 0.0 when the Index closed below its 20 day moving average yesterday. Short term traders are taking profits. The sector has a history of underperformance between now and mid-February.
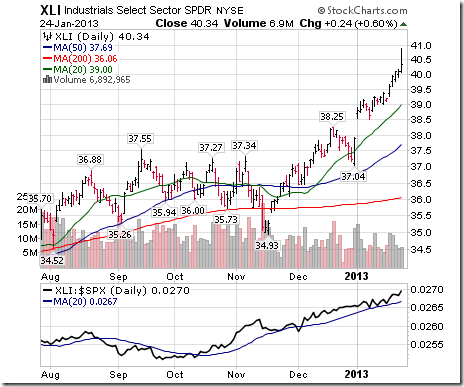
Technical score for the Industrial sector is 3.0. The Index and its related ETF closed at another all-time high yesterday. Seasonal influences are positive until early May.
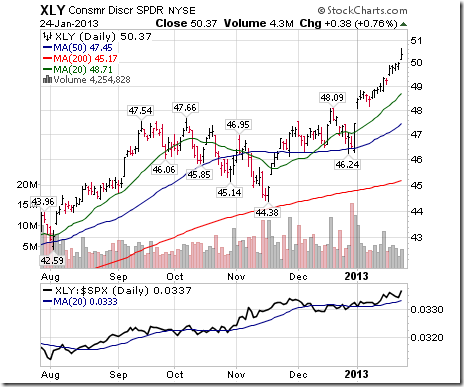
Technical score for the Consumer Discretionary sector and related ETFs is 3.0. The Index closed at an all-time high yesterday. Seasonal influences are positive until mid-April.
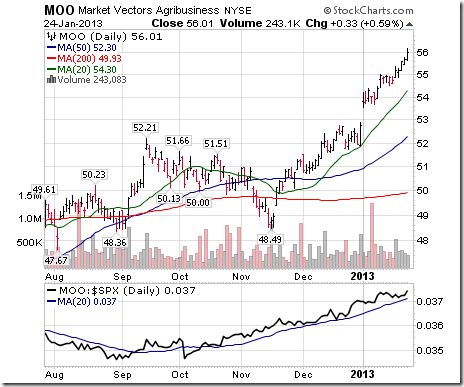
Technical score for the Agriculture ETF is 3.0. The period of favourable seasonality has passed, but technical remain strong. Hold until technical scores start to decline.
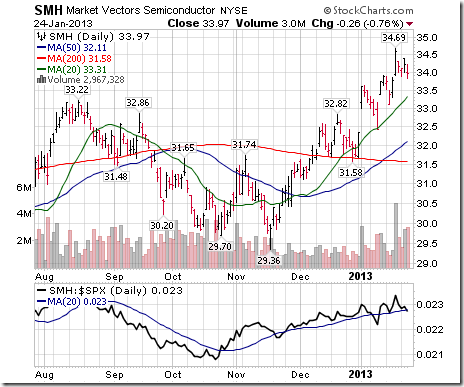
Technical score for the Semiconductor sector is 3.0, but strength relative to the S&P 500 is close to turning negative for a possible downgrade to 2.0. Seasonal influences are positive until the first week in March.
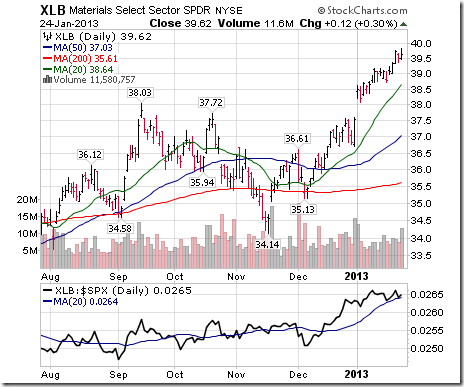
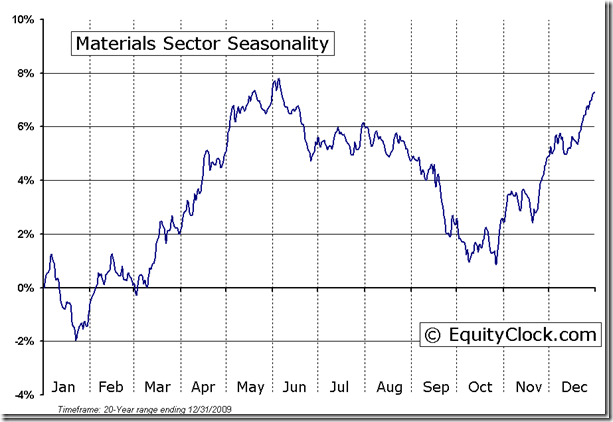
Technical score for the Materials sector is 3.0. Seasonal influences currently are favourable, but turn more positive at the end of February. The Index is heavily weighted in chemical stocks.
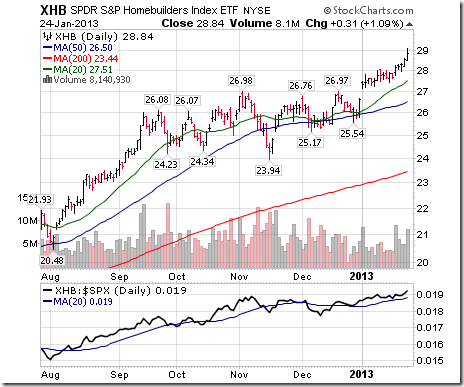
Technical score for the Homebuilders ETF remains 3.0. Its period of seasonal strength ends in the first week in February.
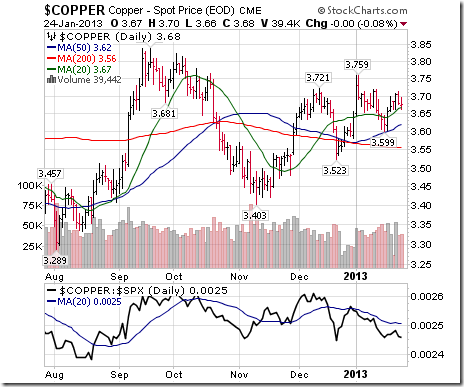
Copper maintains a technical score of 2.0. Relative strength has yet to turn positive. Seasonal strength is positive until May.
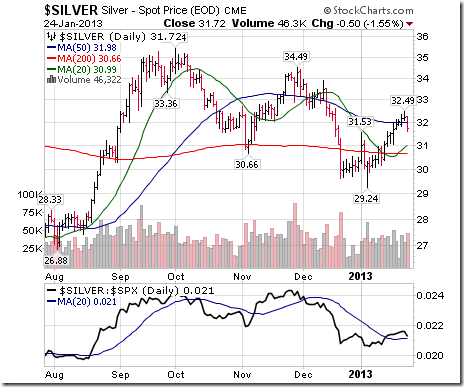
Silver maintained its technical score of 3.0 despite weakness yesterday. Its period of seasonal strength is positive until at least the first week in March.
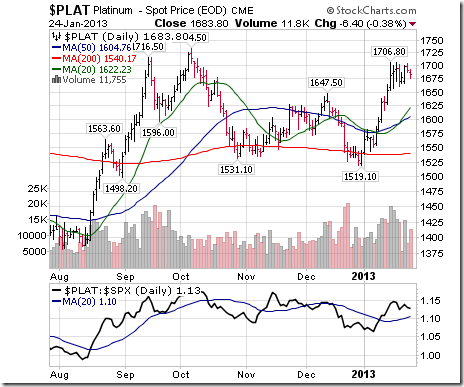
Ditto for Platinum! Technical score is 3.0.
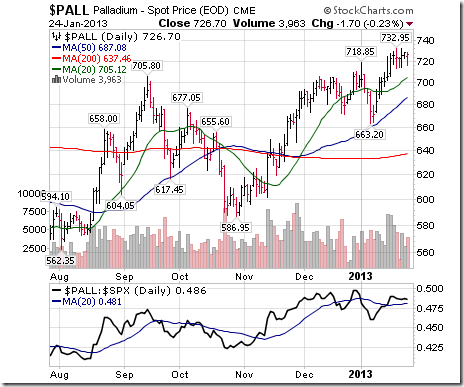
Ditto for Palladium! Technical score is 3.0
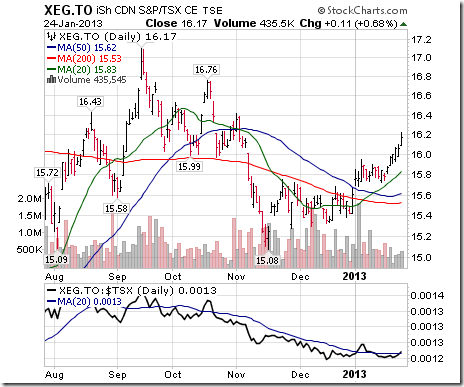
Technical score for Canada’s energy sector changed from 2.0 to 3.0 thanks to confirmation that strength relative to the TSX Composite has turned positive. Seasonal influences are positive until at least early May and possibly mid-June on an extension.
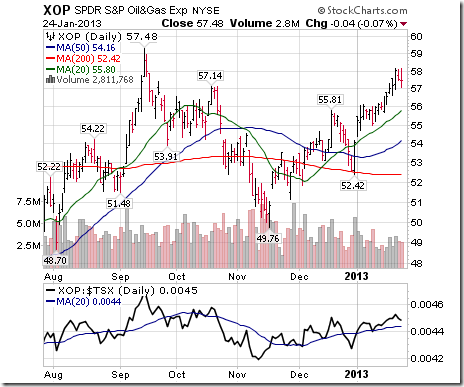
Technical score for the U.S Oil & Gas Exploration and Development sector is 3.0. Seasonal influences are positive until the end of April.
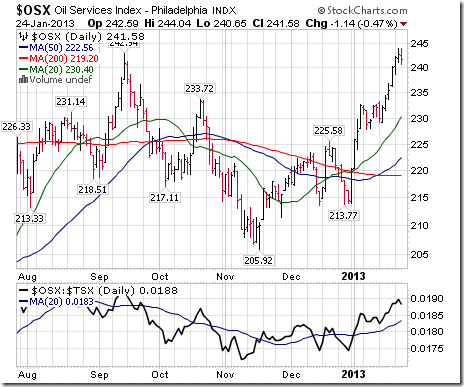
Technical score for the Oil Services sector is 3.0. Seasonal influences are positive until May 9th
Thackray’s 2013 Investment Guide
Thackray’s 2013 Investor’s Guide is here. Order through www.alphamountain.com , Amazon, Chapters or Books on Business.
Special Free Services available through www.equityclock.com
Equityclock.com is offering free access to a data base showing seasonal studies on individual stocks and sectors. The data base holds seasonality studies on over 1000 big and moderate cap securities and indices.
To login, simply go to http://www.equityclock.com/charts/
Materials Sector Seasonal Chart
Eric Wheatley’s Weekly Column
Hello to all you as-yet unthawed readers,
I remember when the VIX was still a new and extremely esoteric index. Volatility is a vague concept at its simplest (the standard deviation of a randomly chosen data set), so a 30-day annualised implied volatility index – actually based upon a variance swap, which is important to know – shouldn’t intuitively have become a cornerstone index for market commentators everywhere. Yet here we are: you can now buy or sell numerous ETFs and futures on the index and you can even buy or sell options on the products based upon an index which measures options prices [which pretty much just resembles the pivotal scene from Being John Malkovitch in terms of circular reasoning].
Given that Mr. Vialoux has always granted me editorial freedom in this forum, I’ll take a stab at formulating my opinion of the VIX and its application to regular people: it’s like planning your summer 2015 wedding and choosing the date based upon average temperatures and rainfall in Winnipeg over the past ten years. To wit: the VIX measures implied volatility in the first two expiries of S&P 500 index options. If you own the S&P 500 or its proxies (e.g. SPY or XSP), it’s like living in Winnipeg in our example; that is, the data can be a little relevant. If your holdings are geographically diversified, focused on certain industries or hedged, then it would be like living in Halifax and using Winnipeg data. Not to say that the information has NO relevance, but it certainly isn’t ideal.
As long as you understand that index options are different animals from stock options (Reference: I used to trade index options and futures primarily and stock options off of our index positions) and that the data come from a small corner of the markets, then yes, the VIX can be relevant. Since it is based on one of – if not the – most liquid options classes in the world and is used by most every type of market participant, it can give you some insight into whether people are buying or selling options more generally. This, in turn, can help you get some instinctive feel for market sentiment. What I get a little bent out of shape about is that people place just a little too much credence in the number.
To get back to our previous weeks’ subject, on December 31st the VIX spiked. This was a very good coincident indicator of the market’s going a little goofy ahead of the uncertain fiscal situation in the States. Since then, the index has dropped back into its regular dozy little underpriced groove. For many months now, people have been stating quite confidently that this means that the market is about to experience a major reversal of fortune, because the VIX is KNOWN to be a contrarian indicator and it’s at record lows. In fact, the market has been quite volatile (or at least it was a few months ago), but yield-hungry options sellers are keeping volatilities particularly low, much like bond or dividend yields which are also extremely unyielding nowadays.
As with everything else, you have to get to know what you’re studying and understand its behaviour. On a charting website, I’ve no lessons to give to people who, by their very nature, understand the subjectivity and ambiguity of certain indicators and their occasional false signals.
*****************
In this week’s French-language blog: gods in machines, Algerian memories and the seventh circle of hell.
Cheers!
Éric Wheatley, MBA, CIM
Associate Portfolio Manager, J.C. Hood Investment Counsel Inc.
eric@jchood.com
514.604.2829; 1.855.348.2829
Twitter: @jchood_eric_en
Blogue en français : gbsfinancier.blogspot.ca
*****************
Little known fact about John Charles Hood #58
John Charles Hood is well acquainted with Dante’s œuvre. Luckily, he’s remained extremely limber and will do well in limbo.
Tech Talk’s Weekly ETF Column
(Published yesterday at www.globeandmail.com )
Headline reads, “Beat the U.S. indexes with these Canadian ETFs”. Following is a link to the report:
http://www.theglobeandmail.com/globe-investor/funds-and-etfs/etfs/beat-the-us-indexes-with-these-canadian-etfs/article7784752/
Disclaimer: Comments and opinions offered in this report at www.timingthemarket.ca are for information only. They should not be considered as advice to purchase or to sell mentioned securities. Data offered in this report is believed to be accurate, but is not guaranteed.
Don and Jon Vialoux are research analysts for Horizons Investment Management Inc. All of the views expressed herein are the personal views of the authors and are not necessarily the views of Horizons Investment Management Inc., although any of the recommendations found herein may be reflected in positions or transactions in the various client portfolios managed by Horizons Investment Management Inc
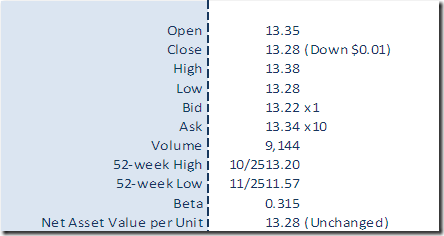
Horizons Seasonal Rotation ETF HAC January 24th 2013
Copyright © TechTalk


![clip_image001[1] clip_image001[1]](https://advisoranalyst.com/wp-content/uploads/HLIC/471fb8b94419ec4599abd2ecd86f4914.png)
![clip_image003[1] clip_image003[1]](https://advisoranalyst.com/wp-content/uploads/HLIC/e378f6601e5c2f0cc3285cee48d5ef79.png)
