by Don Vialoux, Tech Talk
Upcoming US Events for Today:
- No Significant Events Scheduled
Upcoming International Events for Today:
- Euro-Zone Industrial Production for November will be released at 5:00am EST. The market expects a year-over-year decline of 3.1% versus a decline of 3.6% previous.
- The Canadian Business Outlook Survey will be released at 10:30am EST.
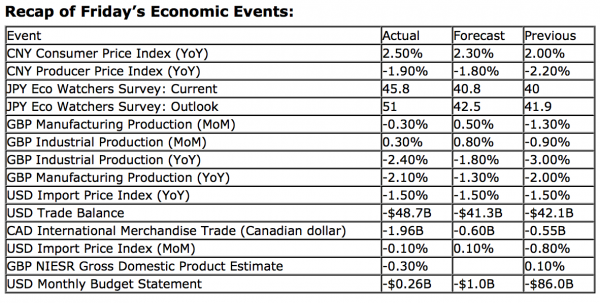
Markets ended around the flat-line on Friday as a negative reaction to earnings from Wells Fargo failed to sway market sentiment. The financial company beat both on the top and bottom lines, but a decline in net interest margins had investors selling the stock. Financials and Industrials were the worst performing sectors during the session, while Consumer Staples topped the leader board, suggesting a somewhat risk-off day. Earnings season picks up this week with 87 companies reporting, including other financial companies, such as Goldman Sachs, JP Morgan, Bank of America, and Citigroup. Finanicals enter a period of seasonal strength in the month of January, running through to April.
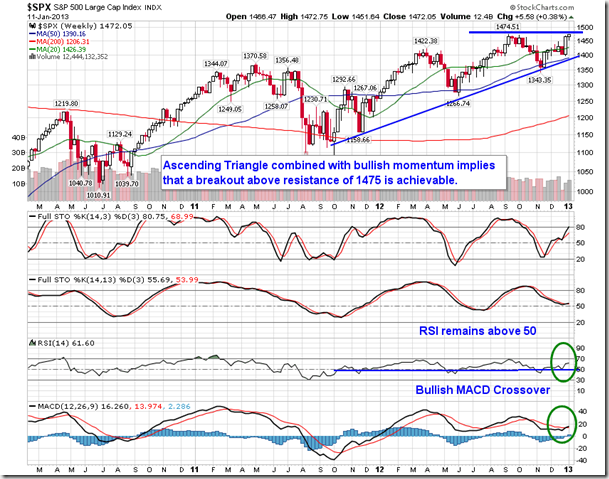
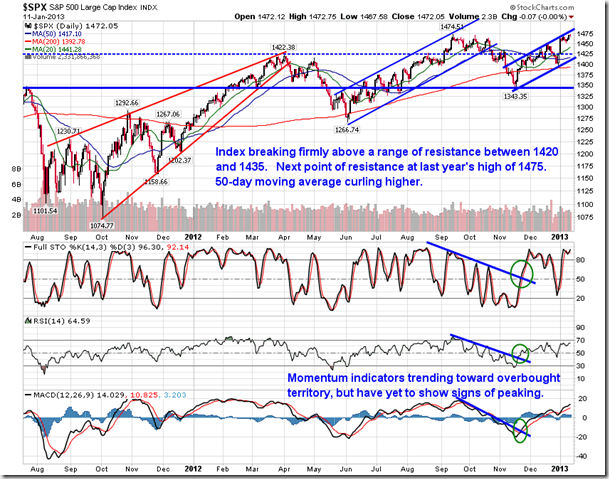
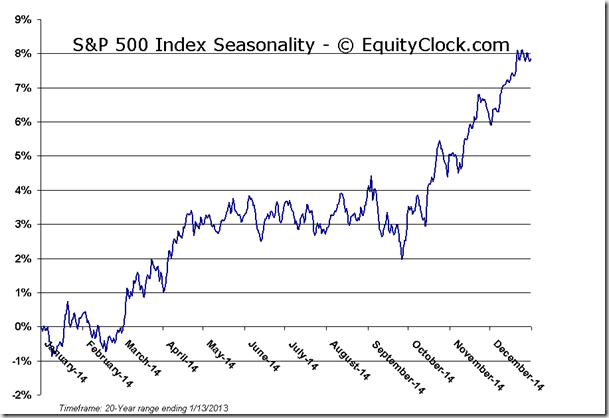
Despite the lackluster session on Friday, the S&P 500 still managed to add 0.38% on the week, extending the gains of nearly 5% over the past two weeks. Looking at a weekly chart of the index, a bullish MACD crossover was recorded last week and RSI remains firmly above the 50-level, implying bullish momentum. An ascending triangle pattern is becoming apparent with resistance around 1475. This technical pattern is customarily bullish and implies the continuation of the previous trend, which is positive. A breakout above resistance of 1475 would likely pull substantial sums of assets into the equity markets, resulting in volume confirmation of the move as investors race to capture the stock market strength. Bond markets are expected to suffer. However, beyond this bullish breakout, upside capitulation could result in exhaustion of the longer-term trend, suggesting a retrace of some sort is bound to occur. For now, rising support, presently around 1400, should lead to a breakout of resistance of around 1475, setting the market up for a push toward all-time highs of 1575. Seasonal tendencies for equity markets remain flat to negative into February, but turn positive once again from March into May.
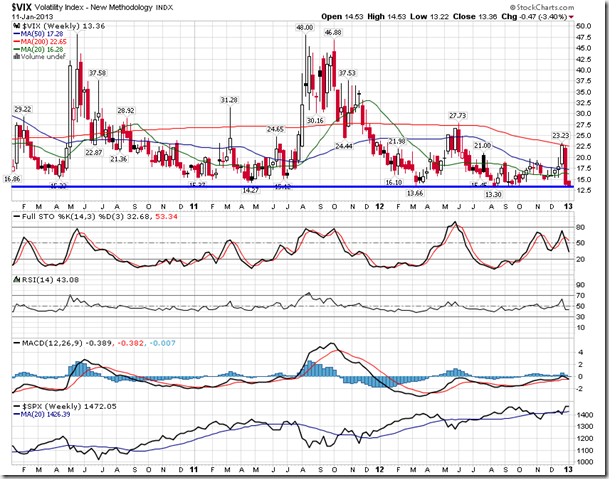
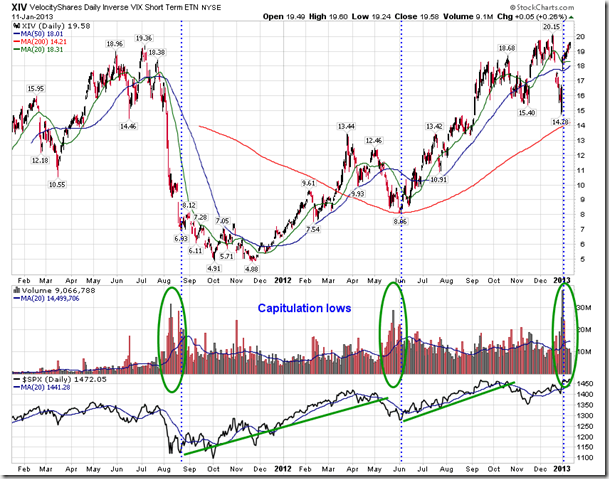
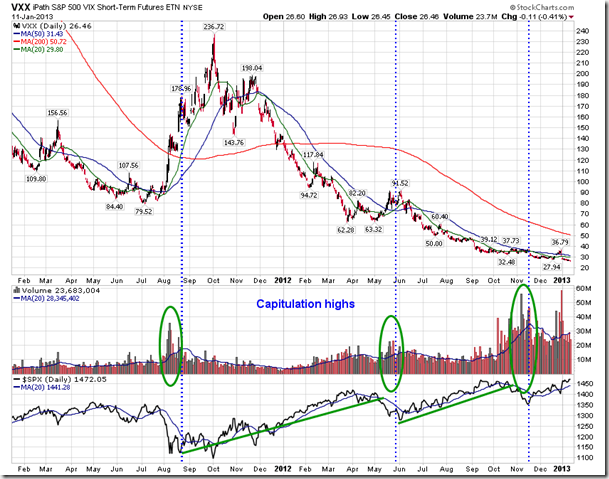
The last couple of weeks of strong equity markets have brought upon a plunge in the Volatility Index (VIX), leading many analysts to speculate that investors are way too complacent. Although signs of complacency started to become evident in the put-call option ratio at the end of last week, only a bullish bias remains warranted. The VIX is presently trading around the end of last summer’s lows, having fallen precipitously to open the year. But at debate is whether or not this is really a signal to be cautious as market peaks have customarily followed. Keep in mind that investors cannot trade the VIX as it’s value is derived from option prices. However, a number of ETFs have attempted to provide a vehicle from which to gain exposure to the “fear gauge”. XIV in an Inverse Short-Term VIX ETN, which falls as volatility rises. Since it’s launch, two capitalization lows have been recorded as a result of heavy selling attributed to volatility spikes. As volatility fades and volume returns toward more normal levels, equity markets have shown gains over the months to follow. A capitulation low was recorded at the end of last year and, if the pattern remains consistent, further gains in equity markets could be implied. Similar capitulation peaks can be picked out of the VIX Futures ETN (VXX) as volume spikes have typically preceded the next intermediate-term up-leg in equity markets. The volatility within the volatility index may be implying a buy signal rather than anything more negative.
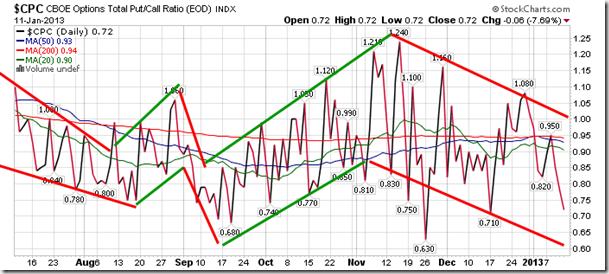
Sentiment on Friday, as gauged by the put-call ratio, ended bullish at 0.72. As mentioned previously, at the end of last week the put-call ratio started to suggest a sense of complacency amongst investors. The ratio closed the week just above December’s low of 0.71, which was recorded just prior to the S&P 500 peaking for the month. The risk is that a “shock” event is realized and portfolios are not protected, leading to significant selling pressures. But in absence of a significantly negative event, equity investors can remain complacent while the market continues to move higher.
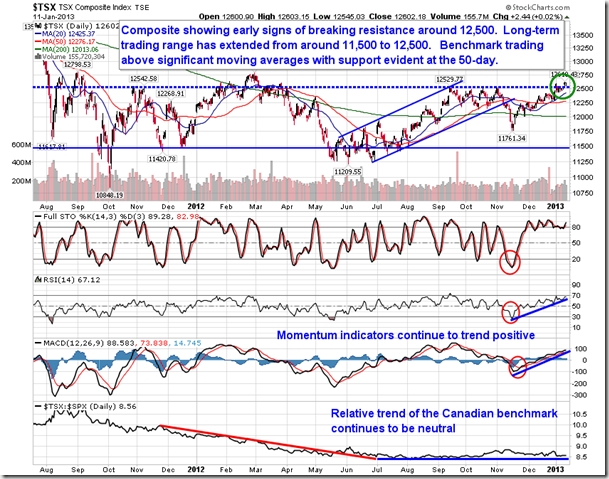
Chart Courtesy of StockCharts.com
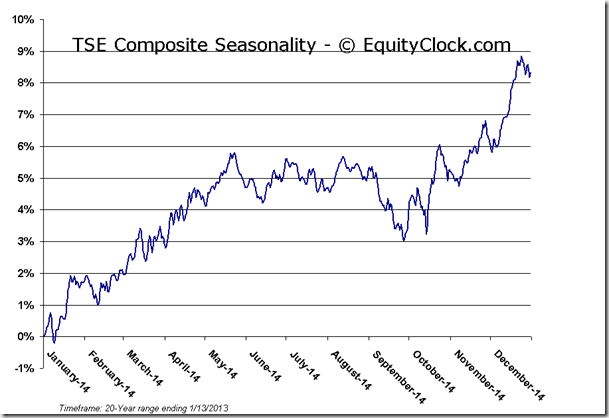
Chart Courtesy of StockCharts.com
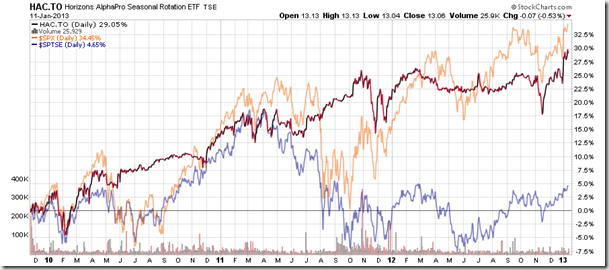
Horizons Seasonal Rotation ETF (TSX:HAC)
- Closing Market Value: $13.06 (down 0.53%)
- Closing NAV/Unit: $13.07 (down 0.13%)
Performance*
| 2013 Year-to-Date | Since Inception (Nov 19, 2009) | |
| HAC.TO | 2.78% | 30.7% |
* performance calculated on Closing NAV/Unit as provided by custodian
Click Here to learn more about the proprietary, seasonal rotation investment strategy developed by research analysts Don Vialoux, Brooke Thackray, and Jon Vialoux.


