by Don Vialoux, EquityClock.com
Upcoming US Events for Today:
- Consumer Price Index for July will be released at 8:30am. The market expects an increase of 0.2% versus no change (0.0%) previous. Core CPI is expected to show an increase of 0.2%, consistent with the previous report.
- The Empire Manufacturing Survey for August will be released at 8:30am. The market expects 7.00 versus 7.39 previous.
- Treasury International Flows for June will be released at 9:00am.
- Industrial Production for July will be released at 9:15am. The market expects an increase of 0.5% versus 0.4% previous. Capacity Utilization is expected to show 79.2% versus 78.9% previous.
- The NAHB Housing Market Index for August will be released at 10:00am. The market expects no change at 35.
- Weekly Crude Inventories will be released at 10:30am.
Upcoming International Events for Today:
- The Bank of England Minutes will be released at 4:30am EST.
- Great Britain Jobless Claims Change for July will be released at 4:30am EST. The market expects 7,000 versus 6,100 previous.
The Markets
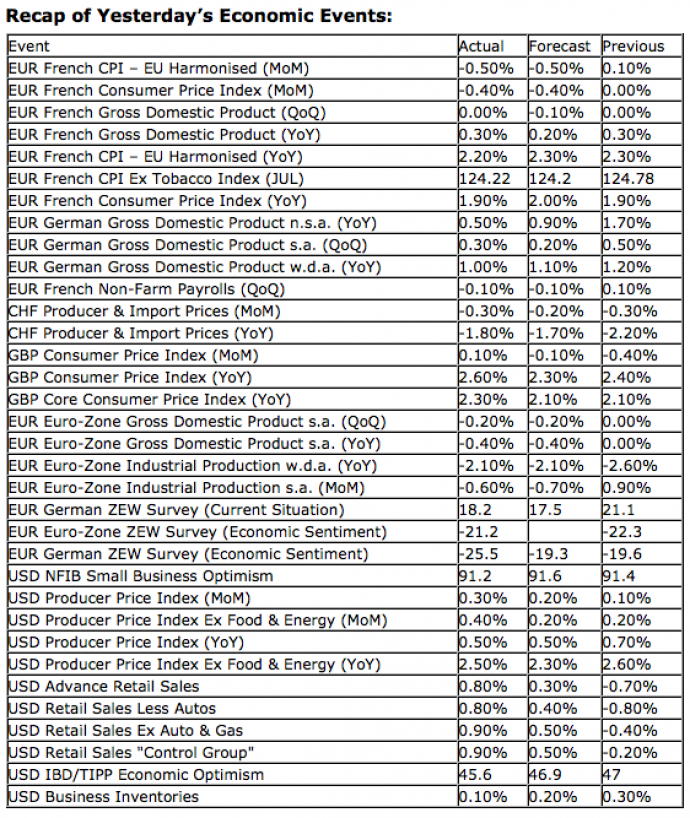
Markets ended mixed, yet again, on Tuesday as enthusiasm surrounding better than expected economic data in the US failed to carry equities throughout the day. Retail Sales for July were reported to be significantly better than expected, increasing by 0.8% over the course of the month compared to analyst estimates of a gain of only 0.3%. However, as Zerohedge.com points out, seasonal adjustments were a significant factor behind the report as retail sales actually declined by 0.9%. Seasonal adjustment skew in economic data has been rather ubiquitous for the majority of the year due to factors such as weather and trends in economic data from previous years providing a distorted comparable. Data is expected to become more normalized as we near the Fall months.
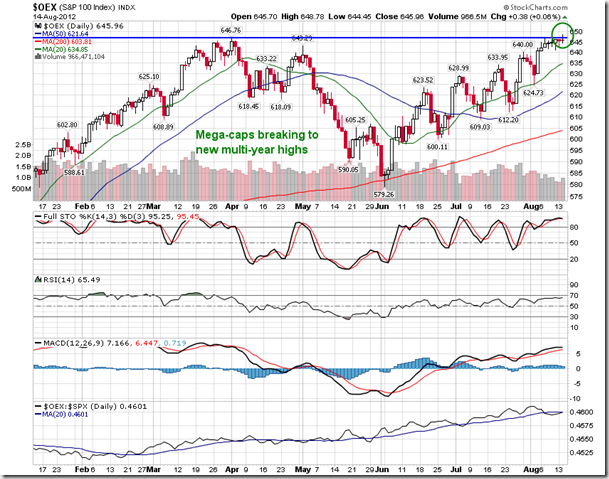
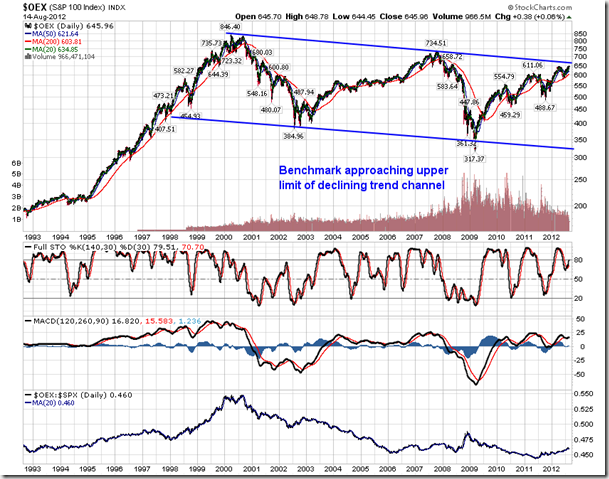
As equity benchmarks, such as the S&P 500 and Dow Jones Industrial average, start to show signs of resisting around year-to-date highs, the S&P 100 Index charted a new 4-year high on Tuesday at 648.78, although ending slightly off of this level by the closing bell. The S&P 100 is composed of the largest and most established companies in the world, with stock prices that are usually less volatile than the overall market. As a result of the low beta composition, it is no wonder that investors are flocking to these “mega-cap” stocks during this period of uncertainty. The benchmark has been outperforming the S&P 500 for the past year as a result of the approximately 2% dividend yield, which is better than the yield on 10-year treasury notes. The benchmark is now approaching the upper limit of a multi-year declining trend channel that dates back to the all-time highs for this index in 2000. Another benchmark at or near trendline resistance.
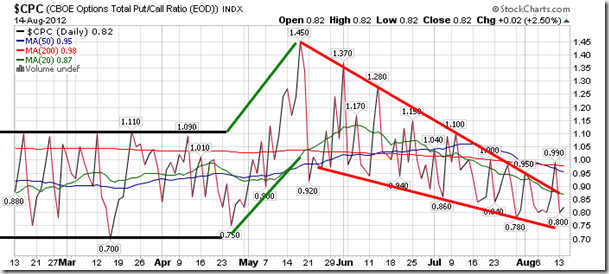
Sentiment on Tuesday, as gauged by the put-call ratio, ended bullish at 0.82.
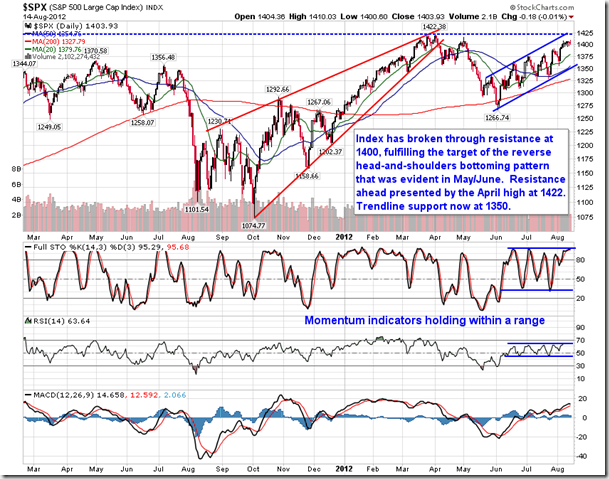
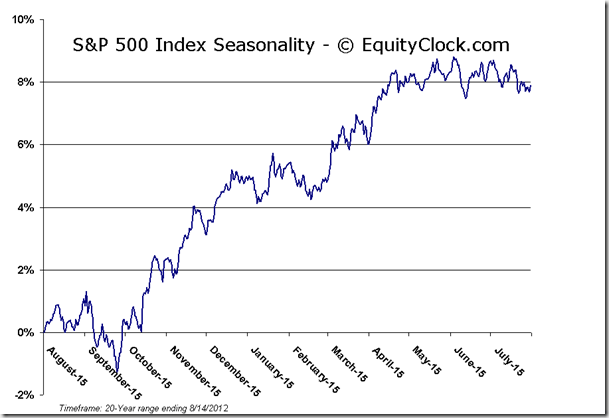
S&P 500 Index
Chart Courtesy of StockCharts.com
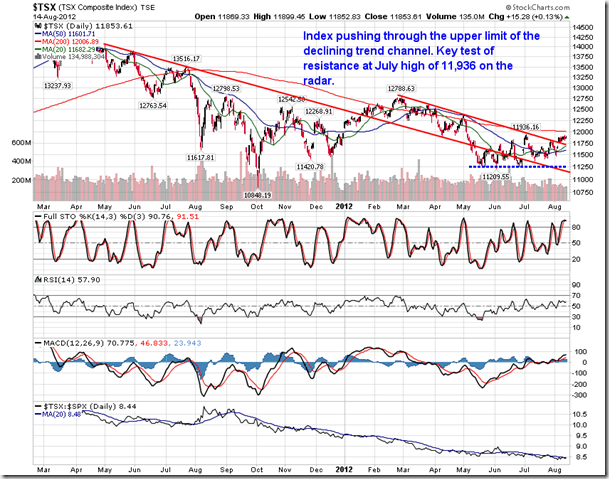
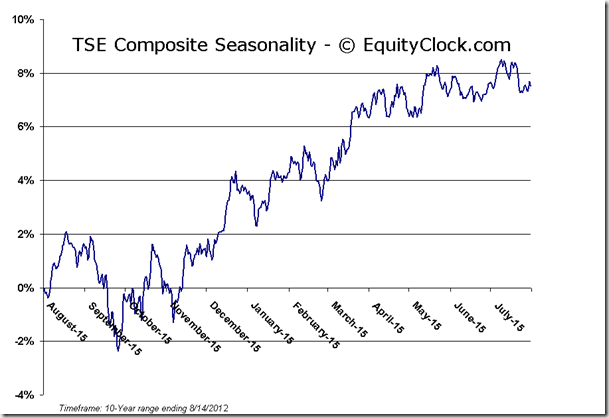
TSE Composite
Chart Courtesy of StockCharts.com
Horizons Seasonal Rotation ETF (TSX:HAC)
- Closing Market Value: $12.40 (up 0.32%)
- Closing NAV/Unit: $12.37 (unchanged)
Performance*
| 2012 Year-to-Date | Since Inception (Nov 19, 2009) | |
| HAC.TO | 1.56% | 23.7% |
* performance calculated on Closing NAV/Unit as provided by custodian
Click Here to learn more about the proprietary, seasonal rotation investment strategy developed by research analysts Don Vialoux, Brooke Thackray, and Jon Vialoux.


