by Russ Koesterich, Portfolio Manager, iShares
A few weeks ago, I was sitting on an industry panel with a financial advisor who was talking about his client experiences over the last couple of years. He mentioned that market volatility has driven many of his clients away from investing in the equity markets, but that minimum volatility ETFs (such as the iShares MSCI USA Minimum Volatility ETF – USMV) have provided them with a way to dip a toe back in the markets without taking on an uncomfortable amount of risk. The advisor compared these funds to “bowling with bumpers.”
I thought this was a great analogy, and not only because I’m a terrible bowler. The concept of most of these minimum volatility ETFs (or min vol, as we call them around here) is that they track indexes that seek to capture the broad equity market with a reduced amount of volatility. By minimizing volatility, these indexes seek to provide better risk-adjusted returns and protect against some of the downside risks that occur in the market from time to time.
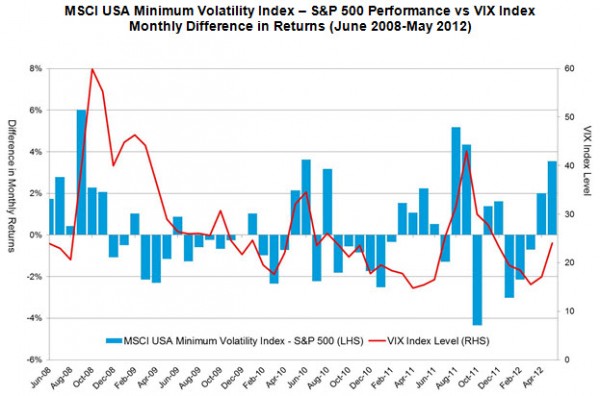
In the chart below, the red line represents the VIX Index, also referred to as the “fear index”, which is commonly used to reflect market volatility. The blue bars in the chart represent the monthly performance difference between the MSCI USA Minimum Volatility Index and the S&P 500. When the blue bar is above the zero percent axis, the min vol index is outperforming the S&P 500. Conversely when the blue bar is below the 0 axis, the min vol index is underperforming.
 When volatility is rising, equity markets have typically faltered because there is a lot of fear in the market. As you can see from this chart, when the VIX was rising, the min vol index was usually outperforming the S&P 500. In other words, when the equity markets were dropping, the min vol index acted as a cushion in these volatile markets, providing stronger relative performance. However, when fear started to ease out of the market and the VIX began to decline, the S&P 500 generally outperformed the minimum volatility index.
So if a min vol strategy tends to outperform the broader equity markets when volatility is on the rise, yet underperform when volatility abates, wouldn’t it just be a wash? Not so fast. The chart below shows the performance of the same two indexes over the same time period with both set to a base value of 100 points. Here you can see that by limiting the downside during some of the deepest troughs of a volatile market, the min vol index was better able to capitalize on a rebound.

My colleague and fellow iShares blogger Daniel Morillo has talked about the low risk anomaly in the past. Basically, this anomaly leads to the idea that from a performance measurement standpoint, minimum volatility indexes have captured a greater percentage of the upside than they have on the downside. For example, based on the monthly index returns in the second chart, the min vol index captured about 77% of the upside of the market, yet only captured about 61% of the downside. Furthermore, it did so with roughly 25% less risk than the S&P 500 (measured by standard deviation), creating a smoother ride and superior risk-adjusted returns.
And this is why I like the “bowling with bumpers” analogy. Minimum volatility indexes seek to minimize the effects of the occasional gutter ball, allowing investors to focus more on their long-term investment objectives – the pins at the end of the alley.
Source: Bloomberg
Daniel Prince, CFA, Vice President, is a member of the iShares ETF Due Diligence Team. The team reviews models, recommended lists and platforms for partner firms and delivers collaborative and timely information on new product, product enhancement, educational and competitive intelligence content.
Mr. Prince’s service with the firm dates back to 2007, including his years with Barclays Global Investors (BGI), which merged with BlackRock in 2009. At BGI, Mr. Prince was a senior sales strategist for the US iShares Sales Strategy team. Prior to joining BGI, Mr. Prince was a senior analyst at Wilshire Associates.
Mr. Prince holds the Chartered Financial Analyst designation and is a member of the CFA Society of San Francisco. Mr. Prince earned a BS degree in business administration from the Haas School of Business at UC Berkeley in 2003


