by Guy Lerner, The Technical Take
Our bond model turned positive one week ago, and since the bottom in March, 2009, this has generally meant “risk off” for the markets.
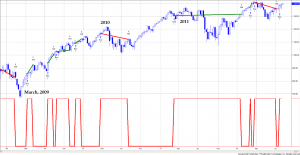
Figure 1 is a weekly chart of the SP500. In the lower panel is an analogue representation of our bond model. Currently with the value “up”, the bond model is positive and we should expect higher bond prices and lower yields. Looking at the SP500, I have put buy and sell signals on the price bars that corresponds to those times when the bond model is positive. As you can see, the bond model was positive during the market tops of 2010 and 2011. In each instance, rising bond prices was forecasting economic weakness that ultimately led to QE2 and Operation Twist.
Figure 1. SP500 v. Bond Model/ weekly

Since March, 2009 with the bond model positive (i.e., falling yields), the SP500 has gained 14.99% on a cumulative basis, and as you can see, the majority of the gains occurred in the initial thrust from the lows. Since 2010, buying equities when the bond model is positive has produced a little gains for your efforts. But there has been a lot volatility. Clearly, this has been the “risk off” period. In contrast, since March, 2009 with the bond model negative (i.e., rising yields), the SP500 has gained 39.04% cumulatively. All 9 trades have been winners.
In summary, our bond model is positive. Over the past 2 years, this has coincided with economic weakness and an equity market top in 2010 and 2011.
Copyright © The Technical Take


