by Guy Lerner, The Technical Take
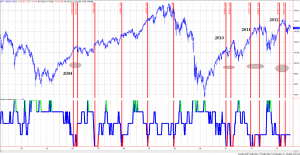
As you know, the Rydex market timers represent a small segment of the investing world. Nonetheless, their actions remain a useful window into the mindset of investors. The Rydex asset data is sentiment data, and it is based upon real asset flows. It is not an investor opinion poll. By tracking the money, we get to see how these investors are placing their market bets. The Rydex asset data provides a clear example of why the current price action is more consistent with a market top as opposed to a launching pad to a new bull market. See figure 1, a weekly chart of the S&P Depository Receipts.
Figure 1 is a composite indicator that is most ideally suited for an intermediate term time frame. This indicator is constructed from the total amount of assets in the Rydex bullish and bearish funds, and it also attempts to assess how much money (or “fuel”) is on the side lines. Over the past several months, each indicator has shown too many bulls, so collectively the current reading is a bear signal (i.e., too many bulls). The pattern in the data that we are looking for is consecutive bear signals (i.e., too many bulls) without any intervening bull signals. And as you can see by the red vertical bars, this is the current pattern, and it also was the pattern in 2004 (that led to a 12 month consolidation), 2010 (market top) and 2011 (market top). In essence, this indicator has shown litter bearish sentiment in the markets over the past 3 months. When looking at the past 10 years of data, investor sentiment must become more bearish before a more durable bottom is made.
Figure 1. SPY/ weekly

This is another way of saying that bear signals must be followed by bull signals for prices to move higher.


