A Closer Look at Volatility
Combining Low Beta & Cyclical Strategies
by Alfred Lee, CFA, CMT, DMS
Vice President & Investment Strategist, BMO ETFs & Global Structured Investments
BMO Asset Management
alfred.lee[@]bmo.com
March 2, 2012
Recent Developments:
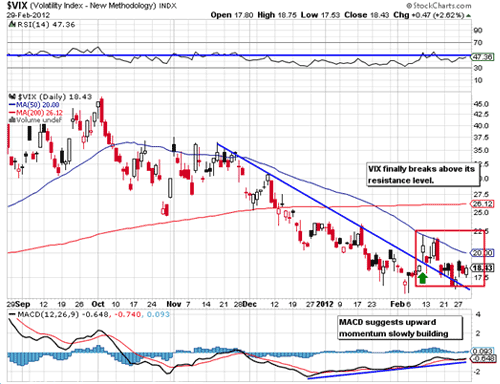
- Equity market volatility, as indicated by the CBOE/S&P Implied Volatility Index (VIX), has steadily declined since early October of 2011. More surprisingly, there have been fewer intraday gaps in the trading of the VIX, suggesting the VIX has been significantly less reactive to negative headlines (Chart A). Currently the VIX is trading at 18.43, a fair amount below its long-term average of roughly 20.
- As the VIX is often used to gauge the nervousness of investors, its recent low readings indicates a normalization of the market. Despite a second round bailout for Greece, better liquidity in the Eurozone due to the European Central Bank’s (ECB), Long-term Refinancing Operation (LTRO) and its swap agreement with five other central banks, significant risk items remain to suggest that the low level of the VIX is not justified. Investors should also keep in mind that volatility has a tendency to revert to its mean.
- Though the risk rally could very well continue given the second tranche of the LTRO, a closer look at the VIX shows that it has likely bottomed. Moreover, measures of the VIX show that its downside momentum has abated.
Potential Investment Opportunity:
- Should volatility suddenly increase, investors may want to consider the BMO Low Volatility Canadian Equity ETF (ZLB), which is an efficient way for investors to access Canadian equities at a lower volatility than the S&P/TSX Composite Index (TSX). This ETF can be utilized as a core position, as part of an investor’s long-term strategic asset allocation. Investors should also note that low beta stocks have historically outperformed the market over the long-term. However, since there are periods when higher beta equities outperform the market, a more cyclical oriented position can be tactically combined with ZLB to potentially generate alpha in the portfolio.
- Provided that the year to date rally in risk assets continues and recent comments by U.S. Federal Reserve chairman Ben Bernanke did not spook the market, investors may want to tactically rotate a limited portion of their portfolio to some higher beta areas. This week’s announcement of another €529.5B (US$712.8B) commitment in the second tranche of the LTRO could potentially extend the recent rally, providing a further tail wind. Investors that are interested in tactically increasing the beta in their portfolio, may want to consider our BMO S&P/TSX Equal Weight Global Base Metals Index ETF (ZMT).
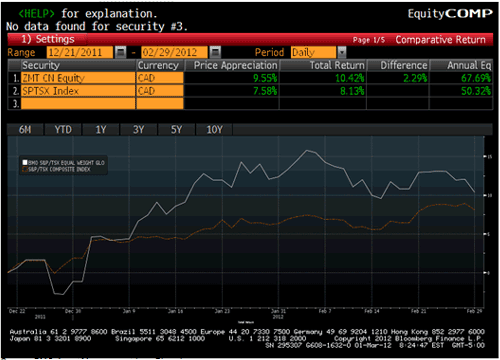
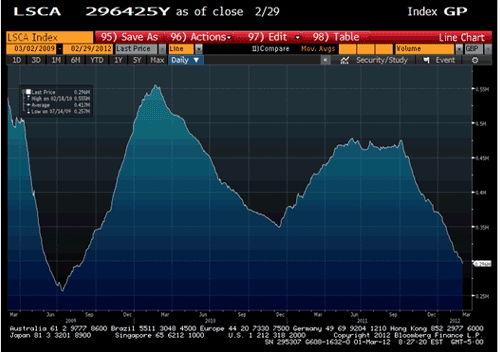
- Since the announcement of the first tranche of the LTRO back on December 21, ZMT has gained 10.4% on a total return basis, compared to the total return of 8.1% of the S&P/TSX Composite Index ending February 29, 2012 (Chart B). Furthermore, copper inventories, tracked by the London Metals Exchange (LME), remain at more than two year lows, due to a lack of mining activity in 2011 (Chart C). China’s recent move to lower its bank’s Reserve Requirement Ratios (RRR) could also potentially provide further upside momentum in base metal equities. However, given the many risk items remaining on a macro-economic level, the increasing sensitivity in the VIX and with no further stimulative measures in place, investors should also consider implementing risk management strategies. Trailing stop-loss orders allow investors to limit their downside and risk could be further controlled through smaller allocations to these areas, which tend to be more sensitive to potential waning investor optimism.
Chart A: The “VIX” Looks to Have Bottomed

Source: BMO Asset Management Inc., StockCharts.com
Chart B: ZMT has Outperformed the TSX Since the Announcement of LTRO

Source: BMO Asset Management Inc., Bloomberg,
Chart C: Copper Inventories Tracked by LME are at More Than Two Year Lows

Source: BMO Asset Management Inc., Bloomberg
*All prices as of market close February 29, 2011 unless otherwise indicated.
Disclaimer:
Standard & Poor’s® and S&P® are registered trademarks of Standard & Poor’s Financial Services LLC (“S&P”) and “TSX” is a trademark of Toronto Stock Exchange. These trademarks have been licensed for use by BMO Asset Management Inc. BMO S&P/TSX Equal Weight Global Base Metals Hedged to CAD Index ET is not sponsored, endorsed, sold or promoted by S&P or Toronto Stock Exchange, and S&P and Toronto Stock Exchange make no representation, warranty or condition regarding the advisability of buying, selling or holding units/shares in the BMO S&P/TSX Equal Weight Global Base Metals Hedged to CAD Index ETF.
BMO S&P/TSX Equal Weight Global Base Metals Index ETF (ZMT), one year return: 5.96% and since inception return: -23.38% (Inception date: October 20, 2009).
Information, opinions and statistical data contained in this report were obtained or derived from sources deemed to be reliable, but BMO Asset Management Inc. does not represent that any such information, opinion or statistical data is accurate or complete and they should not be relied upon as such. Particular investments and/or trading strategies should be evaluated relative to each individual’s circumstances. Individuals should seek the advice of professionals, as appropriate, regarding any particular investment.
BMO ETFs are managed and administered by BMO Asset Management Inc, an investment fund and portfolio manager and separate legal entity from the Bank of Montreal. The indicated rates of return are the historical annual compound total returns including changes in prices and reinvestment of all distributions and do not take into account commission charges or income taxes payable by any unit holder that would have reduced returns. Commissions, management fees and expenses all may be associated with investments in exchange-traded funds. Please read the prospectus before investing. The funds are not guaranteed, their value changes frequently and past performance may not be repeated


