The Absolute Return Letter December 2011
The Facts They Don’t Want You to Know
by Niels Jensen, Absolute Return Partners
What have Bill Gross, John Paulson, Anthony Bolton and Bill Miller all got in common? They are all ‘rock star’ fund managers who have fallen on hard times more recently. Life in the fund management industry is not what it used to be like. Life is tough even for the supremely skilled. Markets are changing, fund managers are struggling to adapt and clients are growing restless as a result. If I told you that the composition of an average UK equity fund changes by 90% a year, would that startle you? How would you feel if I added that the 20 funds with the highest turnover returned just 4.7% to investors in the 3 years to the end of March 2011 whereas the 20 funds with the lowest turnover returned 16.8% over the same period?1
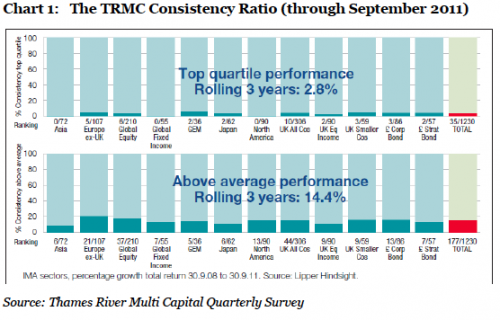
From the same source: Out of 1,230 funds across 12 different strategies, only 35 fund managers produced a performance consistent enough to earn their fund a place in the top quartile in each of the last three years (upper half of chart 1). In a universe of 1,230 funds, over a three year period and completely disregarding skill, the expected number of funds consistently ranked in the top quartile is 1,230*0.253=19.22.
In other words, more than half the 35 managers were there not because of skill but because, statistically, someone was always likely to ‘over-achieve’. This leaves about 15 fund managers out of a universe of 1,230 – ca. 1% - who could with some right claim that they have consistently been in the top quartile.
The problem is we don’t know who they are. All we know is that none of them are managing Asian equities, North American equities or Global fixed income funds as those three strategies didn’t produce a single top quartile performer between them. And when you look at the second, and slightly less demanding, part of the study – those who have been in the top half in each of the past 3 years – the picture is broadly the same (lower half of chart 1). 177 fund managers achieved the required consistency but 154 of the 177 are likely to have done so because of luck, not skill.
I have never come across a fund manager who openly admits that his (or her) outperformance is down to luck. On the other hand, I often come across fund managers who suggest their underperformance is down to bad luck. I suppose no manager ever skilfully underperforms, but to put it down to bad luck is an insult when we all know that human error is the most common cause of underperformance.
If a fund manager’s outperformance is based on skill rather than luck, wouldn’t one expect the majority of the outperformance to come from those stocks with the highest weights in the portfolio? This seems a reasonable assumption given that one would expect any rational fund manager to allocate the most capital to his/her highest conviction ideas.
However, in a study conducted by UK consulting firm Inalytics (see here), 39 of 42 Australian funds managers who outperformed their benchmark owed their outperformance to the ‘underweights’ in the portfolios - suggesting that human error is not only the source of underperformance but perhaps also of some of the outperformance.
Bestinvest produces an annual survey called Spot the Dog (see here for the latest survey) which has gained considerable attention in the UK fund management industry, although it is not a league table you will be proud to be mentioned in. According to the 2011 survey published back in August, over £23 billion is currently managed in so-called dog funds2, an increase of no less than 74% since the previous report.
You don’t become a dog just because you have a bad quarter or two. The members of that exclusive club have a history of serial underperformance, yet they will generate in the region of £350 million of fees to their firms this year despite the obvious value destruction.
And the story gets worse - much worse in fact. According to an unpublished report conducted by IBM, our industry destroys $1,300 billion of value annually – a staggering 2% of global GDP (see here for details). This includes about $300 billion in fees on actively managed long-only funds which fail to outperform their benchmarks, $250 billion spent on wealth management fees for services which do not meet their benchmarks and $50 billion in fees on hedge funds which underperform. Do I need to say any more?
Why are fund managers finding it harder than ever to outperform and what are the long term implications of those miserable performance statistics? Let’s deal with the ‘why’ first. There is no question that managing money – in particular equity mandates – has been a delicate affair over the past decade.
Through the 1980s and 1990s global equity markets benefitted from a strong undercurrent of bullishness. As a result, fund managers went into the bear market of 2000-01 on a wave of optimism (who doesn’t recall the repeated calls in the late 1990s of a new investment paradigm?) epitomised by the record high P/E levels in 1998-1999 just before it all went pear shaped in 2000.


