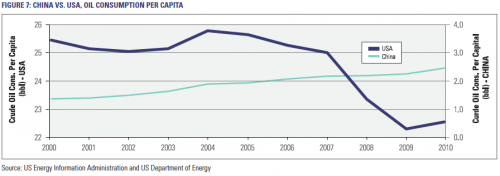
These developments are best illustrated in Figure 7 which contrasts the United States’ oil consumption decline of more than 2 million barrels per day with China’s 1.4 million barrels per day increase. We would argue that we are in the very early stages of this trend as the per capital consumption of the United States is still nearly 10 times that of China, hence the requirement for two axes on the chart.
We should also reflect on the fact the global population is currently passing the 7 billion mark, which equates to a global production per capita of 4.5 barrels per annum. In order for China to move from its current per capita consumption of 2.4 barrels per annum without material domestic production growth, it will need to increase its imports from 5.5 million barrels per day to 13.5 million barrels per day. This would represent an approximate increase of 146% for the Chinese, who currently rank as the world’s second largest importer of oil. The United States, which is the largest importer of oil in the world with just under 9 million barrels per day of imports, would have to reduce consumption by 80% in order to consume in line with the global per capita oil production of 4.5 barrels per annum.
Looking further into this China/United States relationship, we see that significant relative wage growth is underpinning the Chinese oil consumption increase as they are able to afford a greater portion of the global oil supply. As shown in Figure 8 below, the Chinese have achieved a 231% increase in disposable income over the last decade compared to very low growth in the United States.
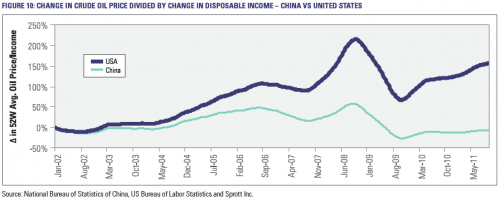
The growth in Chinese disposable income has actually completely offset the rising crude price as shown in Figure 10. Relative to disposable income growth, the price of oil has gone down for workers in China while rising by over 150% for American workers. In addition, Americans have faced rising unemployment while China has created over 80 million jobs during the past decade.6 Furthermore, those fortunate enough to stay employed in the USA also had to deal with the negative wealth effects emanating from multiple stock market declines and a housing market collapse.
We believe that this trend is destined to continue throughout emerging economies like China, which continue to demonstrate a willingness to work harder for a fraction of the wages (or a fraction of the oil) of workers in the developed economies.
The wage comparison table above highlights the differential between US and Chinese workers for select occupations. We have a long way to go before the wage differential between emerging markets and Western economies shrinks enough to stop the flow of jobs and the redirecting of oil exports around the world. As frightening as this may be for the inhabitants of high wage countries like ourselves, it is best to acknowledge the change and to prepare for a reduction in relative purchasing power as these inevitable adjustments flow through the employment, trade and currency markets.


