As for this year's fourth quarter, Thomson Reuters First Call estimates that S&P 500 earnings will be up 17.7%, which would put earnings at $103 per share for the full year. That puts the price/earnings (P/E) ratio at only 13 times, below the historical mean of 17.
Micro story better than macro story
Another positive sign for the stock market is corporate equity issuance (or lack thereof). US corporations have amassed a nearly $2 trillion cash war chest, allowing them to go from huge sellers of stock at the market's weakest point in 2009, to buyers and acquirers of stock in four of the five quarters through 2011's first quarter.
According to a study by Ned Davis Research, when there is excessive net retirement of corporate equities, it's generally good for the stock market.
Retirement is Good
Source: Ned Davis Research, Inc., as of March 31, 2011. (Further distribution prohibited without prior permission. Copyright 2011 Ned Davis Research, Inc. All rights reserved.)
Unless we're wrong and the economy doesn't exit the soft patch soon, US corporations are likely to be a positive factor for the supply and demand for equities.
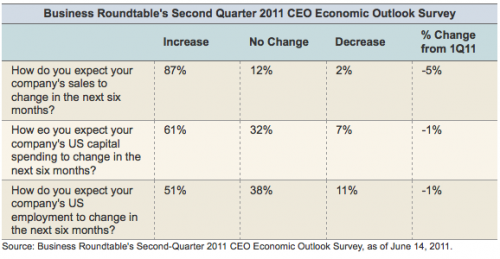
Survey data supports this measure of optimism by corporations. A recent Business Roundtable survey of generally large company CEOs shows that 87% of them are optimistic, as you can see in the table below.
Indeed, that optimism weakened slightly versus the first quarter, but remains quite high in the face of so many macro obstacles. Again, it's the positive micro story versus the negative macro story. One caveat, though: Smaller companies' optimism, though improved, remains relatively weak.
Rally mode!
The stock market may be onto something with its latest powerful rally. Some might suggest the market's become overbought and, based on simple technical analysis, that's true.
However, history shows that thrusts as positive as what we've seen recently tend to bode well for the market over the ensuing short-to-medium term.
During the rally, the 10-day advance/decline (A/D) line of the S&P 500 quickly moved from oversold in mid-June to extremely overbought as of last week's close. As such, it's one day away from making a new bull-market high.
According to Bespoke Investment Group (B.I.G.), since 1990, there have been 15 prior periods when the 10-day A/D had a similar positive reversal in the span of a month. Over the following month, the S&P 500 was up 80% of the time, with an average return of 2%.
In another sign of the strength of the rally, it was only the 10th time in the history of the S&P 500 that the index gained at least 0.75% for five straight days. According to SentimenTrader, after eight of the other nine times, buying the next day and holding for two weeks thereafter, resulted in gains.
That's typical of extreme momentum moves: a short-term counter-reaction, then a longer-term move in the direction of the initial thrust.
It's not just the US stock market that's in rally mode. The majority of the key global markets have just moved back above their 50- and 200-day moving averages, suggesting that the global market trend is back in bullish territory.
July bucks "sell in May"
Finally, for what it's worth, investors were reminded of the "sell in May and go away" phenomenon this year. For those not familiar with the adage, it reflects the typical weakness of the market in the half-year from May through October. However, one of the months that has historically bucked that trend is July—typically a strong month.


