The Government Debt Trajectory
There are a number of assumptions needed to calculate the growth in government debt relative to GDP, some more plausible than others. The key ingredients are the starting primary balance (the deficit net of interest payments), estimates of how it will change and the difference between the growth rate of the economy and the rate of interest. We use the Congressional Budget Office (CBO) calculations as a starting point as it is generally recognized as the authority. The CBO baseline projection assumes no change in basic laws (e.g., all of Bush’s tax cuts expire) or discretionary spending and is totally unrealistic.
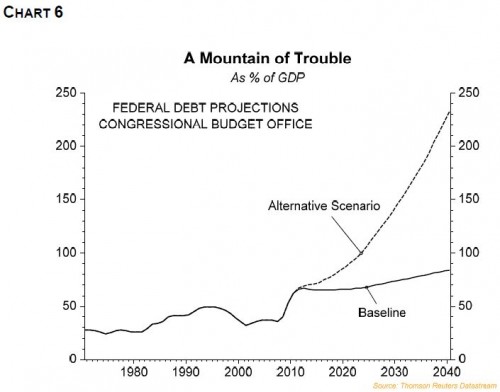
The most plausible projection is the CBO’s “alternative fiscal scenario”[2. For definitions of baseline and alternative scenario please see CBO website: http://www.cbo.gov/ftpdocs/115xx/doc11579/SummaryforWeb_LTBO.pdf] which is based on several fairly conservative assumptions regarding increased spending, for example in Medicaid payments to physicians as well as the reinstatement of Bush’s tax cuts for all but the wealthy. This scenario forecasts Federal debt to GDP rising 25 percentage points by 2020. Assuming state and local government debt to GDP remains around 16%, the total U.S. government debt level would be over 110% of GDP by 2020. This is not too far from Greece’s current level and well above its pre-crisis ratio. The calculation is pretty close to the IMF’s more elaborately constructed outcome. Chart 6 shows the CBO’s Federal debt baseline and alternative scenario projections. As can be seen, the alternative scenario, which we think is the best one to use, rises sharply in the next ten years and thereafter explodes upwards.
![]()
However, even the CBO’s alternative projection for the U.S. is naively optimistic because it assumes GDP growth averaging 2.9% for the next ten years and no recession. The U.S. has never experienced a ten-year period with no recession, and the growth rate they assume is the same as that during the debt-fuelled bubble years of 1980-2007. If we assume that the 2010-2020 period will be one of deleveraging and crowding out of private investment, growth is likely to be significantly less than in that earlier period.
Interest rate and inflation assumptions are much more vulnerable to error. The key here is the gap between real growth and the interest rate the government has to pay on its debt. When the gap is unfavorable (rates above growth), debt explodes upward. In the U.S. currently the two are fairly close. The 10-year inflation adjusted (TIPS) bond yield is currently 1%, about the same as the economy’s current growth rate. However, as we recently saw in Greece, when the market smells trouble, capital will flee, causing growth to head south and interest rates north with little or no warning (Chart 7).
Chart 7![]()
The bottom line is that a total U.S. government debt (including state and local) above 110% of GDP by 2020 will turn out to be a significant under-estimate, if no serious action aimed at fiscal consolidation occurs. It should also be noted that age and health related spending are not the key factors pushing up debt by 2020. Those pressures come to bear after 2020 and will eventually play total havoc with the U.S. fiscal position, as shown in Chart 6, if swift, decisive action is not taken now.


Comments are closed.