This article is a guest contribution by Boeckh Investment Letter.
The great reflation—a combination of various stimulus packages, bank bailouts and built-in fiscal stabilizers—worked its magic in preventing the economic downturn of 2008-2009 from morphing into another great depression. Calculations by Alan Blinder and Mark Zandi[1. Alan S. Blinder and Mark Zandi, “How the Great Recession was Brought to an End”, Blinder-Zandi Report, July 27, 2010.] indicate that, without those actions the economic downturn would have been three times deeper and unemployment would have almost doubled from its 10% peak. Our sense is that the economic and financial crisis would have been even more devastating than that because those calculations ignore the psychology of panic. Failure to “put out the fire” would have risked burning the whole forest down.
The reflation, however, was only Act I. Now we are into Act II which is all about dealing with the long-run consequences of massive and escalating government debt. In addition, governments will soon have to face age-related effects on their expenditures for health and social security and on economic growth.
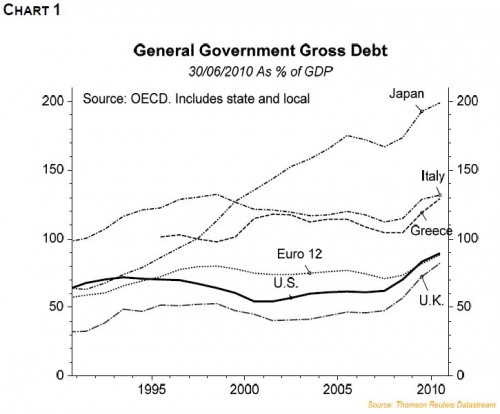
Total gross U.S. government debt was approximately 90% of GDP in 2010, of which over 80% is Federal. Chart 1 provides comparisons of the U.S. with some other big debtors. The U.S. is well behind Japan, Italy and Greece but ahead of the UK and the Euro area.
![]()
That the U.S. is in a dangerous debt situation is hardly a secret. Yet nothing will be done about it any time soon. Politicians, now back from their holidays, are focused on securing re-election. Republicans are moving further to the populist right. Cutting deficits has once again taken a back seat to spending and minimizing taxation. It is often said that the electorate get what they deserve and one of those things is huge government debt, which is going to get much bigger. There is a rapidly escalating Greek-style debt:GDP scenario unfolding and all the consequences that go with it.
Below we discuss how fast and how far the debt trajectory will track. But first, let’s look at some of those consequences.
The Consequences of Excessive Government Debt
The long-term structural consequences of growing U.S. government deficits must be seen in the context of declining U.S. private savings. Chart 2 shows that U.S. private savings have fallen progressively since the era of the bubble began in 1982, reaching a post-war low around 1.2% of income just prior to the crash. Savings have since rebounded as households and businesses are trying to reduce debt, but it remains to be seen how long this will last. Federal budget deficits have absorbed an increasing share of those dwindling savings ultimately taking almost 100% prior to the crash (Chart 3). The consequence has been that non-residential net investment has fallen from 6% of GDP to near zero before the crash. That dwindling amount of investment has increasingly been financed by the Chinese and other surplus countries which now hold about $3-4 trillion in highly liquid U.S. dollar balances and short-term Treasury bonds. This is a reflection of the steady and dramatic deterioration of the U.S. net international investment position over the 25 bubble years (Chart 5).


Comments are closed.