


by Jeffrey Saut, Chief Investment Strategist, Raymond James
“Nobody can consistently time the stock market’s ups and downs.”
. . . An old stock market “saw”
We have heard the statement, “Nobody can consistently time the stock market’s ups and downs;” and, for the most part we agree with that. However, if one listens to the message of the market, one can certainly decide if one should be “playing hard,” or not playing so hard. This view has to do with our often repeated statement about managing risk. As Benjamin Graham wrote in the book The Intelligent Investor, “The essence of portfolio management is the management of RISKS, not the management of RETURNS.” Graham closed that thought by noting, “All good portfolio management begins and ends with this premise.” We will note that our long, intermediate, and short-term models have done a better job than most of smoothing out many of the “wiggles” in the various markets. Accordingly, we were quite impressed with Leon Tuey’s latest missive, where he wrote:
There is a common belief that timing is not important and that no one can time the market. I beg to differ. Those who hold such beliefs are ignorant of the market’s logic. Also, it may well be just propaganda by the fund industry for if investors can identify a bull market top and pull their money out, what would the funds do for a living?
If investors understand the market’s logic, they can divine the future direction of the market (long-term, or shorter term). It is not rocket science. Understanding the market’s long-term direction is of primary importance. If investors had bought the following blue-chip stocks at the top in 2007 - Berkshire Hathaway, 3M, Microsoft, Royal Bank of Canada, United Technologies and hundreds ofothers, they would have lost 50% or more at the end of the bear market in March 2009 and they didn’t get even until early 2013.
To understand how a bull market begins and how it ends demands a deep understanding of the economic cause/effect relationships that drive the markets. The following must be clearly understood and appreciated.
The U.S. Federal Reserve System was created in 1913 to perform all roles monetary. It’s an independent body. One of its key statutory mandates is “To maintain orderly economic growth and price stability” (unlike the European model, which is primarily concerned with price stability). The most powerful tools at the Fed’s disposal to effect monetary policy changes are the basic monetary policy variables, bank reserve requirements, margin requirements, and the discount rate. Changes in the Bank Reserve Requirement and the Margin Requirement are infrequent; the discount rate changes the most frequently. When the Fed raises/lowers the Bank Reserve Requirement, however, investors should pay close attention as when it happens, it signals monetary tightening/easing. The single most bullish indicator for the stock market is when the Fed lowers the Bank Reserve Requirement; it’s a clear signal of monetary easing. To encourage investments, or to dampen speculation, the Fed will lower or raise the Margin Requirement. The Discount Rate is the only policy variable that changes frequently. Monetary tightening is when the Fed raises the Discount Rate many times in succession; drains liquidity from the system (contraction in the year-over-year rate of growth in the Adjusted Monetary Base, MZM, and M2. Data are available in U.S. Financial Data, reported every Thursday evening by the Federal Reserve Bank of St. Louis); and inversion of the Classic Yield Curve (13-week T-Bill yield vs. 30-year T-Bond yield).
The Fed’s mandate must be clearly understood and appreciated. Failure to do so will leave investors in a state of perpetual confusion and at the mercy of the “noise.”
To divine the market’s long-term trend, I monitor six factors to help me detect how a bull market begins and how it ends. These are the monetary (the most important and the real drivers of the market’s long-term trend), economic, valuation, sentiment, supply/demand, and momentum/internal/technical. The valuation and supply/demand factors are imprecise in terms of timing. Nevertheless, they must be closely monitored. The momentum/internal/technical factors don’t drive the market; they tell investors about the health of the market.
As mentioned on numerous occasions, if nothing else, if investors only understand and appreciate the following, they will always be on the right side of the market and will never be influenced by others’ opinions or news headlines:
- Investors must understand the role of the U.S. central bank (the Fed). The U.S. Federal Reserve System was created in 1913 to perform all roles monetary, but one of their key statutory (written in law) mandates is to “To maintain orderly economic growth and price stability.” This agency has more and better information on the economy than anyone in the world. It was not created to promote hyperinflation or to create depressions. The Fed’s key mandate must be clearly understood and appreciated.
- The stock market is a leading economic indicator. The economy does not lead the stock market. Hence, once these two points are clearly understood and remembered, the market’s logic becomes apparent. Hence, when the economy slows and heads into a recession, the Fed will ease and will keep easing until the economy responds (remember, that’s their mandate). The stock market, being a leading economic indicator, will have bottomed 6-9 months before the recovery begins, not after. For example, "the market" bottomed in October, 2008 and the recession ended at the end of June, 2009 and a [market] recovery commenced, eight months ahead of the [economic] recovery. Conversely, when the economy overheats; inflation surges; and speculation is rampant, the Fed will tighten by draining liquidity from the system and raise interest rates in an attempt to cool the economy. The stock market, being a leading economic indicator, will head south long before the onset of a slowdown or recession, not after. This chain of logic is so simple that anyone with an IQ slightly above room temperature would understand it. Yet, most on Wall Street with umpteen degrees and decades of experience can’t figure it out.
IDENTIFYING A MAJOR MARKET BOTTOM
- The economy is in bad shape; jobs are hard to find; and headlines are black. Capacity utilization plunges. Talk of depression is widespread. The talking heads will declare “this time is different. They (the Fed) has lost control.”
- Investors are crying the blues as their portfolios are showing huge losses. Worldwide, investors panic and a sense of despair and hopelessness prevails. Brokers are sleeping like babies; theywake up every hour and cry.
- The Fed eases by injecting liquidity into the system and lowers the Discount rate three or more times in succession and will keep easing until the economy responds.
- The Classic Yield Curve (13-week T-bill Yield vs. 30-year T-bond Yield) starts to steepen (short rates below the long rates).
- The interest-sensitive sectors such financials, bonds, preferred shares, utilities bottom and start to head North while the major market averages continue to head south. Mesmerized by the decline in the market indices, investors are unaware that a “rolling” bottom has begun.
- As the Fed eases further, the growth and consumer discretionary issues bottom while the major market averages move yet to new lows.
- The market becomes grossly undervalued.
- Investors are sitting on a mountain of cash and hold little equities. They have no appetite for stocks.
- A selling climax occurs as investors panic. Seized by fear, investors “throw the baby out with the bathwater” as they can’t bear the loss anymore and are convinced the world will end. An emotional catharsis occurs and stocks move from weak hands into strong hands.
The bear market ends and a bull market begins.
IDENTIFYING A MAJOR MARKET TOP
- The economy is booming; workers are hard to find; and headlines are glowing. Capacity utilization is running full tilt.
- Investors are euphoric and the stock market becomes topic du jour at cocktail and dinner parties. Waiters, taxi drivers, bartenders, and shoeshine boys are giving clients hot tips; they think they are market mavens. Everyone is a genius and have the keys to Fort Knox.
- Euphoria reins. Investors are heavily invested in equities and hold little cash.
- Stock brokers, confusing their own genius with a bull market, buy Ferraris and Lamborghinis and dine in uber expensive restaurants.
- The economy overheats, inflation surges; and speculation is rampant. Consequently, in their attempt to cool the economy, the Fed tightens meaningfully by draining liquidity from the system and raises interest rates numerous times.
- The market becomes grossly overvalued.
- After a long period of flattening, the Classic Yield Curve is inverted (short rates higher than long rates). Then, as the economy deteriorates, the yield curve starts to steepen (short rates start to move below the long rates).
- Interest–sensitive sectors such as financials, bonds, preferred shares, utilities along with consumer discretionary, start to head south. Meanwhile, dragged up by the late-cycle issues, the major market averages keep moving to new highs. Investors are lulled by the new highs in the market indices, not realizing the broad market is already heading into a bear market. Not surprisingly, the various Advance-Decline Lines start to head south 3-6 months before the major market averages. New Highs start to contract and New Lows expand.
- Finally, the major market averages top and join the rank and file by heading in a southeasterly direction.
The call for this week: We are on the West Coast seeing accounts, speaking at conferences, and doing gigs for our financial advisors and their clients. If past is prelude the markets will do something in our absence. Unsurprisingly, last week we received no less than 30 emails about the ten Hindenburg Omens that have been registered over the past two weeks (read: telegraphing a stock market crash). That indictor, however, is being triggered by the selling of interest-rate-sensitive ETFs and closed-end bond funds. Meanwhile, as we wrote last Friday:
“[Next] week we could see more powerful upside energy, but at this point it’s not looking all that powerful either. It’s more likely we’ll see more energy come into the market as we get closer to the [mid] November energy peak.”
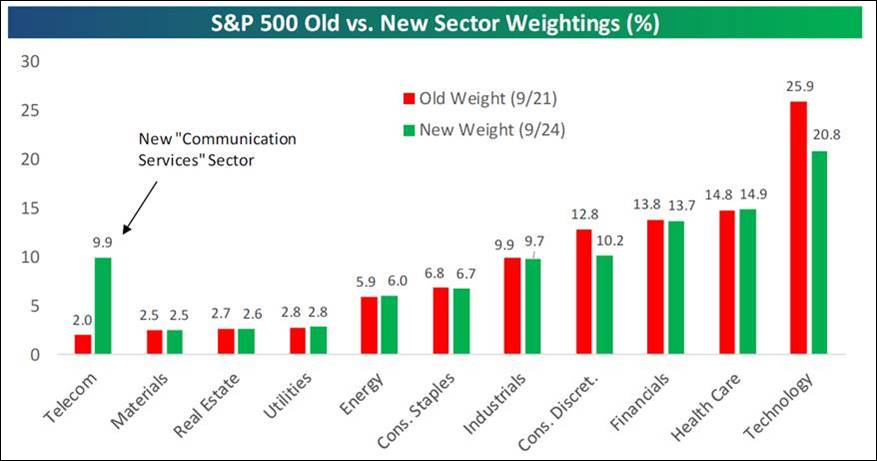
Quite frankly, given the low energy mix stocks typically “drift,” which is exactly what happened last week as we suggested. It may be more of the same this week, but should develop into something more powerful to the upside over the next few weeks. As a sidebar, the recent changes in S&P sector weightings are worth mentioning. Of particular note is that Telecommunication has gone from a 1.98% weight to a 9.9% weight (see chart below).
Yesterday, the equity markets caught an unexpected tailwind, although we have repeatedly said Canada was going to “blink” on NAFTA, and we think China will do the same. Evidently, the equity markets expect the same, but yet the equity markets could not hold on to yesterday’s gains into the closing bell. That is consistent with our upside “drift” call. Of our unpublicized letter yesterday, which is being published today, a day late, we stand by this strategy and embrace our upside trading target of 2980 – 3000 despite “calls” of this is JUST a range-bound stock market . . . GOOD GRIEF!
Chart 1
Additional information is available on request. This document may not be reprinted without permission.
Raymond James & Associates may make a market in stocks mentioned in this report and may have managed/co-managed a public/follow-on offering of these shares or otherwise provided investment banking services to companies mentioned in this report in the past three years.
RJ&A or its officers, employees, or affiliates may 1) currently own shares, options, rights or warrants and/or 2) execute transactions in the securities mentioned in this report that may or may not be consistent with this report’s conclusions.
The opinions offered by Mr. Saut should be considered a part of your overall decision-making process. For more information about this report – to discuss how this outlook may affect your personal situation and/or to learn how this insight may be incorporated into your investment strategy – please contact your Raymond James Financial Advisor.
All expressions of opinion reflect the judgment of the Equity Research Department of Raymond James & Associates at this time and are subject to change. Information has been obtained from sources considered reliable, but we do not guarantee that the material presented is accurate or that it provides a complete description of the securities, markets or developments mentioned. Other Raymond James departments may have information that is not available to the Equity Research Department about companies mentioned. We may, from time to time, have a position in the securities mentioned and may execute transactions that may not be consistent with this presentation’s conclusions. We may perform investment banking or other services for, or solicit investment banking business from, any company mentioned. Investments mentioned are subject to availability and market conditions. All yields represent past performance and may not be indicative of future results. Raymond James & Associates, Raymond James Financial Services and Raymond James Ltd. are wholly-owned subsidiaries of Raymond James Financial.
International securities involve additional risks such as currency fluctuations, differing financial accounting standards, and possible political and economic instability. These risks are greater in emerging markets.
Investors should consider the investment objectives, risks, and charges and expenses of mutual funds carefully before investing. The prospectus contains this and other information about mutual funds. The prospectus is available from your financial advisor and should be read carefully before investing.
Copyright © Raymond James