


by John Lynch, Chief Investment Strategist, LPL Financial, and Jeffrey Buchbinder, CFA, Equity Strategist, LPL Financial
KEY TAKEAWAYS
Though charts comparing 1987 to 2017 look similar, gains leading up to 1987 were much stronger.
We believe that the stock market is standing on a much stronger fundamental foundation today, making another crash appear unlikely.
As we reflect on this anniversary, let’s appreciate this bull market but not get complacent. Market events don’t repeat themselves, but they sometimes rhyme.
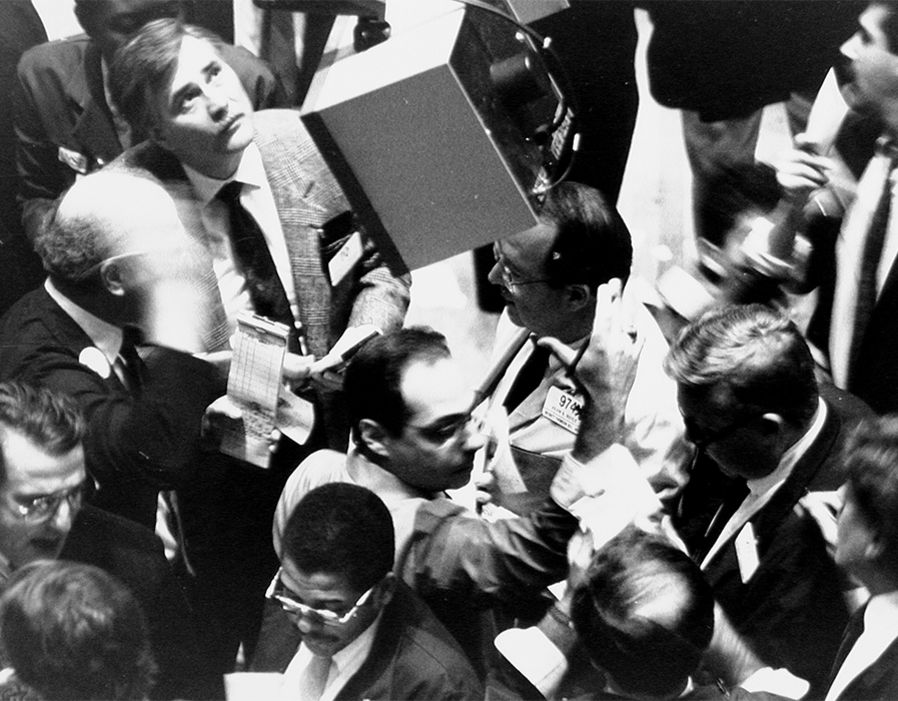
This week marks the 30th anniversary of the 1987 stock market crash in what has come to be known as Black Monday. The Dow plunged more than 22% on that day—the equivalent of a more than 5,000-point drop today—while markets around the world suffered severe declines as well. Here we look back at the crash, draw some comparisons to today’s market environment, and offer some comfort to those who may fear a repeat.
Quick recap
We certainly won’t be able to go into much detail on the 1987 crash here because of word count considerations (you’re welcome). But if this anniversary leaves you wanting more background, there are many books on the topic.
At a high level, some blame Black Monday on computer-driven trading that exacerbated the selling (think “flash crash” in more recent terms) and a hedging strategy known as “portfolio insurance” that had gained popularity (too much popularity, in hindsight, as too many institutions were on the same side of the trade at the same time). Once panic began to set in, buyers stepped away, computer programs responded to selling with more selling, and subsequently there was no one to step in and buy, so prices collapsed.
A flawed market structure, shortcomings in the regulatory framework, and the government’s efforts to slow leveraged buyouts and stop insider trading were also cited on the list of causes. But for the crash to occur, a number of more traditional fundamental forces had to propel so many to sell. More on that below…
SIDEBAR: Important disclosure: This commentary relies on accounts from those who had front row seats to one of the worst days in Wall Street history. The authors of this report did not have front row seats—one was just getting started on Wall Street and the other was filling out college applications. Both had more hair and none of it was gray.
Performance comparison
Some may have seen the charts on social media that are comparing the stock market in 1987 to today. So let’s start by debunking the theory that another crash is coming. While it’s true that the two years look similar, and we acknowledge that stocks are due for a pullback, comparing a chart of the S&P 500 Index today to that of 1987 to make a bear case is misleading.
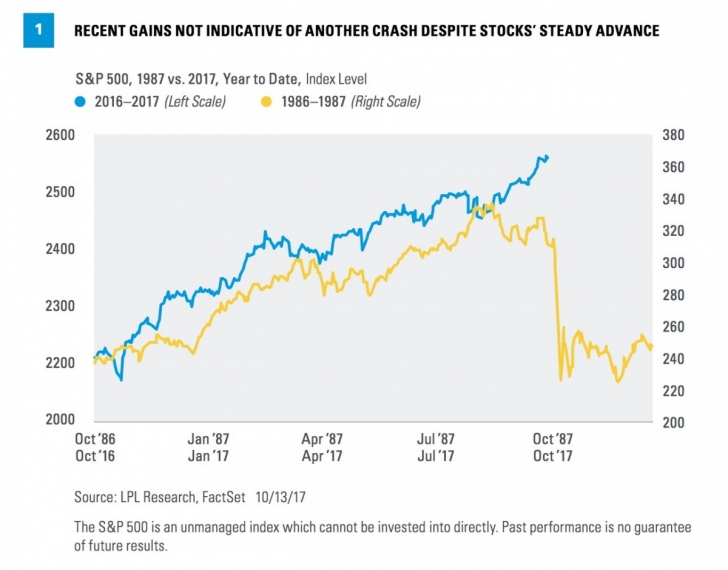
In Figure 1, the two lines showing S&P 500 performance look similar in the months leading up to October for both time periods (1986–1987 and 2016–2017), but the scales are very different. The 100-point increase in the 1980s on the right scale is a much bigger percentage than the roughly 450 points on the 2016–2017 scale on the left. Although it isn’t very obvious in Figure 1, stocks surged in 1987. The S&P 500 was up nearly 40% year to date in late August 1987. Even just one week before the crash, on October 12, 1987, the S&P 500 was up 28% year to date. This year, stocks are up solidly—the S&P 500 is up 14% year to date—but that is a far cry from the pre-crash gains in 1987.
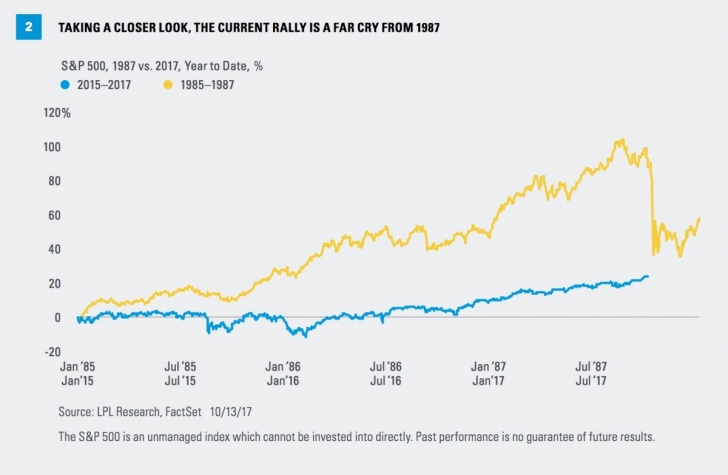
The contrast between these market environments is more dramatic when using percentages, as we have done in Figure 2. We also use a longer, three-year window to further strengthen the point. From the start of 1985 through the 1987 peak, the S&P 500 more than doubled in price (a greater than 100% gain). Over an equivalent time period today (the start of 2015 through the 2017 peak), the S&P 500 is up 24%. Stocks were a lot more stretched back then, making a sharp move lower more likely.
Fundamental comparison
From a fundamental perspective, a number of concerns spooked investors ahead of Black Monday. One of the more unique characteristics of the crash was how many different factors came together at once, such as:
High interest rates. The 10-year yield rose from 7.0% on January 9, 1987, to 10.2% on October 16 of that same year. That’s a sharp increase and a high level for 10-year yields, far from the situation today.
Tighter monetary policy. Alan Greenspan had just replaced Paul Volcker as Chairman of the Federal Reserve (Fed) in June 1987 and raised the Fed’s discount rate in September 1987. We are in a tightening cycle now, but the Fed has been very gradual and transparent and rates remain stimulative.
U.S. dollar collapse. After reaching an all-time high in March 1984, the U.S. Dollar Index began a sharp decline that continued through 1987. Even though the dollar is weakening today, the decline is far less severe, started from a much lower level, and policymakers are not talking the greenback down as Treasury Secretary James Baker did in 1987.
Rising oil prices. Oil prices were rising steadily from the summer of 1986 through August 1987, sparking inflation worries. Today, oil prices have been at or near $50 per barrel for the past 15 months and inflation is well contained.
Geopolitical concerns. The headlines in the mid-1980s centered on how the U.S. compared to Japan in the global economic hierarchy and ending the Cold War. Today’s concerns are similar in some ways (substitute China for Japan) and very different in other ways (North Korea and the global fight against terrorism).
Stretched valuations. Stocks got expensive in the mid-1980s at a price-to-earnings ratio (PE) of 14–15, compared to today’s level of 17–18 (on forward 12-month earnings). But interest rates are a key input into stock valuations, so we would argue that a PE of 17 with a 10-year yield at 2.3% is cheaper than a PE of 14 with the 10-year yield at 10%.
Technical/sentiment comparison
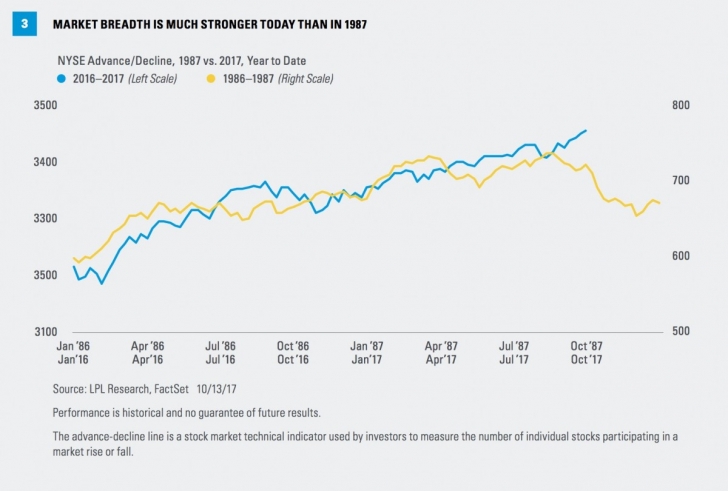
Comparing technical analysis characteristics can be instructive when looking back at the market conditions that contributed to the 1987 crash. One indicator that highlights a clear distinction is the advance-decline (A/D) line, a measure of market breadth [Figure 3]. An A/D line shows how many stocks are advancing versus declining on a various index or stock exchange. If many stocks are falling yet the overall index hasn’t yet broken lower, it is a warning sign that something could be wrong as relatively few stocks are propping up the index. That is indeed what happened in 1987, whereas today’s technical picture is much stronger with an upward trending NYSE A/D line. Taking a more global perspective, Ned Davis notes that its measure of global breadth, which was rolling over in 1987, just set a record high this month.
Finally, a quick look at sentiment is also instructive here. Derivatives positioning then versus now suggests investors were more euphoric then than they are now. And the American Association of Individual Investors Bulls versus Bears survey, which began in 1987, has a long enough history (barely) to compare sentiment then versus now. In September 1987, the percentage of bulls registered at 60%. The highest reading this year is 41%, reflecting some healthy skepticism, and from a contrarian perspective, reducing the odds of a market collapse.
Could it happen again?
We believe that the stock market stands on a much stronger fundamental and technical foundation today than it did in October 1987, with less euphoric sentiment, making another crash like 1987 appear unlikely. Improvements in regulations and market structure can be debated, but investors clearly have better access to information and can trade much more easily.
So on this 30th anniversary of Black Monday, let’s appreciate the gains that we have enjoyed during this bull market but not get complacent. Stocks don’t go up in a straight line. Market events don’t repeat themselves, but they sometimes rhyme.
Thank you to Ryan Detrick for his contributions to this report.
*****
IMPORTANT DISCLOSURES
The opinions voiced in this material are for general information only and are not intended to provide specific advice or recommendations for any individual. To determine which investment(s) may be appropriate for you, consult your financial advisor prior to investing. All performance referenced is historical and is no guarantee of future results.
The economic forecasts set forth in the presentation may not develop as predicted and there can be no guarantee that strategies promoted will be successful.
Investing in stock includes numerous specific risks including: the fluctuation of dividend, loss of principal, and potential liquidity of the investment in a falling market.
Because of their narrow focus, specialty sector investing, such as healthcare, financials, or energy, will be subject to greater volatility than investing more broadly across many sectors and companies.
The P/E ratio (price-to-earnings ratio) is a measure of the price paid for a share relative to the annual net income or profit earned by the firm per share. It is a financial ratio used for valuation: a higher P/E ratio means that investors are paying more for each unit of net income, so the stock is more expensive compared to one with lower P/E ratio. Price to Forward Earnings is a measure of the price-to-earnings ratio (P/E) using forecasted earnings for the P/E calculation.
All investing involves risk including loss of principal.
INDEX DESCRIPTIONS
The Standard & Poor’s 500 Index is a capitalization-weighted index of 500 stocks designed to measure performance of the broad domestic economy through changes in the aggregate market value of 500 stocks representing all major industries.
Copyright © LPL Financial