Many well-regarded experts have weighed in on the length and the pricing of common stocks eight and one half years into this bull market. They range from the dire warnings of perma-bears like Marc Faber to more reserved warnings from Howard Marks and Robert Shiller. The chart below shows an example of where we are in relation to history:1
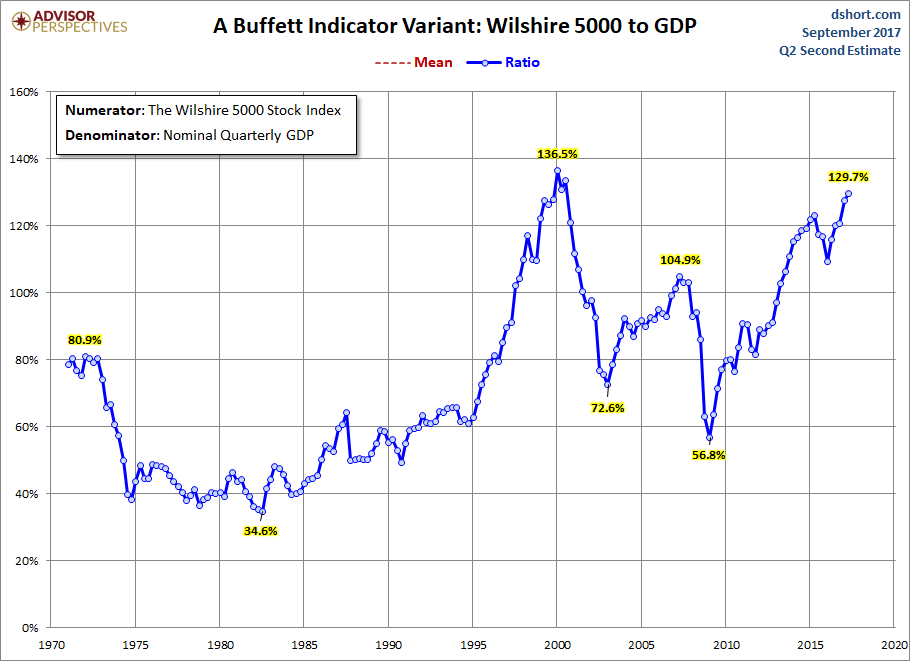
Source: Advisor Perspectives. Data for the time period 1/1/1971 – 6/30/2017.
Separately, Warren Buffett and Jeremy Grantham have argued that the expensiveness of this market must be weighed against the prevailing interest rates. As recently as May of 2017, Buffett said, “If I knew that the ten-year Treasury Bonds would remain near 2%, there were two companies I should have purchased last year.” In theory, the lower the riskless rate the more the future income stream of a company is worth. Grantham has effectively argued that the low interest rates make it “different this time.” The last time that we checked, those are the scariest words in investing.
Therefore, whether you are in the “doomsday” camp, the “watch the interest rate” camp or the long-duration camp with us, the challenge is to find value investments. These value investments must be consistent with how you found value in the past. What does academia tell us about how to find alpha (outperformance) from a historical standpoint? Does this provide a template for how to make money against the current backdrop?
Valuation Matters Dearly
Eugene Fama and Kenneth French exposed the fact that inexpensive stocks outperform average and expensive stocks based on book value. David Dreman, in his book “Contrarian Investment Strategies,” used price-to-earnings (P/E) ratios to prove the same point. Both results were based on annual re-balancing of the S&P 500 Index companies via five price quintiles. Their results are shown in the following charts.2,3
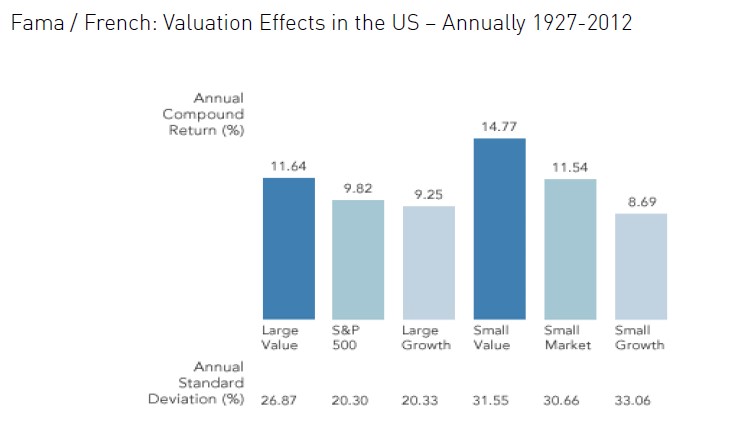
Source: Dimensional Fund Advisors

Source: Dreman Value Management
We love the oldest of these studies from Francis Nicholson, who showed that bargain prices can lead to more alpha when attached to longer holding periods. We believe bargain stocks are the gift which keeps on giving:4
Concentrated Portfolios and Long Holding Periods
Whether you are in bull or bear markets, the academic work shows that alpha can be produced by high conviction portfolios which practice low turnover. Martin Cremers and Ankur Pareek have proven this and given us a chart to help us understand:5
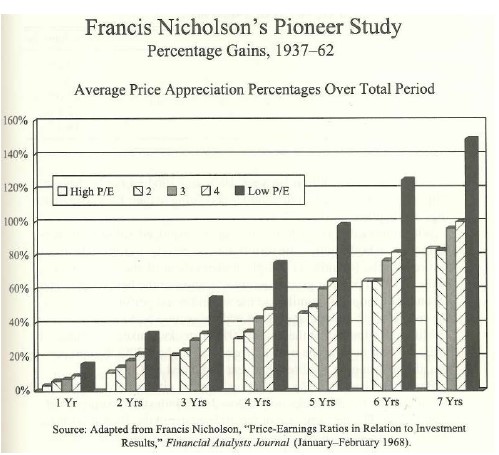
Source: Francis Nicholson study – shown in “Contrarian investment strategies: the next generation”, By David N. Dreman; Pg 143
Concentration (high active share) and low turnover may improve performance on average. Remember, Warren Buffett always reminds us that “excitement and expense are the enemies of your portfolio.” Turnover definitely causes expense.
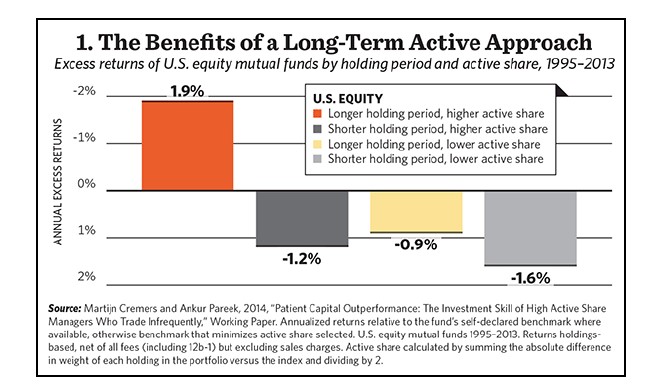
Source: ThinkAdvisor. Data for the time period 1/1/1995 – 12/31/2013.
Quality Adds Value
Ben Inker, via his impressive research at Grantham Mayo Van Otterloo and Co. (GMO), revealed four qualitative factors which demonstrated alpha over a 24-year time period.6
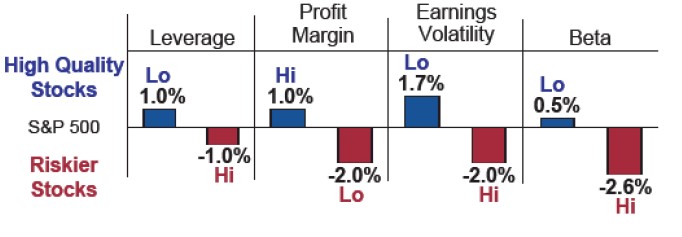
Source: GMO monthly data 1/1982-12/2003.
Can you see the template which the academic studies and history have provided us? We seek to combine bargain purchases made in psychologically difficult circumstances of companies which fit Inker’s quality characteristics and hold them longer than our competitors.
What Industries Dominate the Lowest P/E Quintile?
As of September 25, 2017, the 100 cheapest stocks in the S&P 500 Index were concentrated in 31 financial stocks and 30 consumer discretionary stocks. Older technology stocks were the next most concentrated in the index with 10, followed by 6 industrial stocks. Therefore, if the lowest P/E quintile is going to outperform the S&P 500 over the next five to ten years, it means that the stock market could well have gone overboard on punishing financial and discretionary companies for the negatives which exist in their sector and industry. Here is what the last ten years looked like for the lowest P/E quintile versus the S&P 500:7
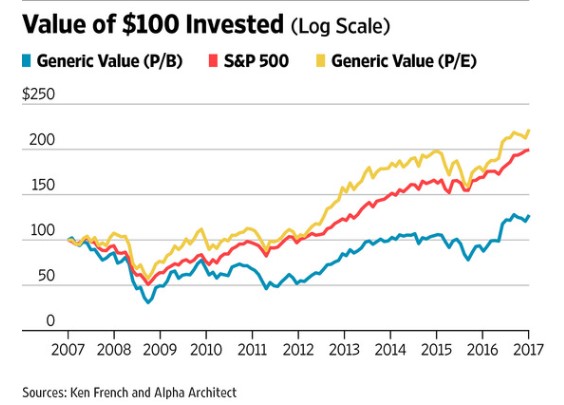
Source: The Wall Street Journal
The other possibility is that value outperforms the S&P 500 by virtue of how horribly growth stocks do and how over-weighted the index has become in high P/E stocks. This was the historical aftermath of the early 1970s “Nifty Fifty” bubble and the Dotcom bubble of the late 1990s.
Merging Value with Quality
At Smead Capital Management, we seek to merge the academic work on quality from Ben Inker/GMO, low turnover and concentration from Cremers and Pareek, with the value work of Dreman and Nicholson. We seek to initiate positions in companies which meet our eight criteria for stock selection when they fall into the lowest P/E quintile. Currently, Alaska Airlines (ALK), Target (TGT), Kroger (KR), Aflac (AFL), Wells Fargo (WFC), Lennar (LEN), JPMorgan (JPM), Bank of America (BAC) and Nordstrom (JWN) are in the lowest quintile.
In our opinion, they are not only quantifiably inexpensive, they are also qualitatively strong in relation to the lowest P/E quintile shares and the S&P 500 overall. We seek companies with long histories of profitability, wide moats, high and consistent free cash flow, strong balance sheets, heavy insider ownership with recent purchases, shareholder friendliness and buy them at price points which are depressed compared to the last five years.
Where Do We Go From Here?
The last ten years included the worst bear market in 80 years. Given the fears of a deep bear market, of mean reversion in U.S. equity performance and mean reversion of Treasury interest rates, there are no guarantees. However, there weren’t any guarantees at any stage of my 37 years in the stock market. Over ten years, we would expect historical academic evidence to be reconfirmed and we will continue to practice long-duration common stock ownership seeking the statistical edges which have worked in the past.
1Source: Advisor Perspectives. Data for the time period 1/1/1971 – 6/30/2017.
2Source: Dimensional Fund Advisors
3Source: Dreman Value Management
4Source: Francis Nicholson study – shown in “Contrarian investment strategies: the next generation”, By David N. Dreman; Pg 143
5Source: ThinkAdvisor. Data for the time period 1/1/1995 – 12/31/2013.
6Source: GMO monthly data 1/1982-12/2003.
7Source: The Wall Street Journal
Alpha is a measure of performance on a risk-adjusted basis. FANG stocks include Facebook (FB), Apple (AAPL), Amazon (AMZN), Netflix (NFLX) and Alphabet (GOOGL). A basis point is one hundredth of one percent. Earnings-per-share (EPS) is the portion of a company’s profit allocated to each outstanding share of common stock. Earnings per share serves as an indicator of a company’s profitability. The price-earnings ratio (P/E Ratio) measures a company’s current share price relative to its per-share earnings. The price-to-book ratio (P/B Ratio) is a ratio used to compare a stock’s market value to its book value. It is calculated by dividing the current closing price of the stock by the latest quarter’s book value per share.
The information contained herein represents the opinion of Smead Capital Management and is not intended to be a forecast of future events, a guarantee of future results, nor investment advice.
Smead Capital Management, Inc.(“SCM”) is an SEC registered investment adviser with its principal place of business in the State of Washington. SCM and its representatives are in compliance with the current registration and notice filing requirements imposed upon registered investment advisers by those states in which SCM maintains clients. SCM may only transact business in those states in which it is notice filed or qualifies for an exemption or exclusion from notice filing requirements.
This newsletter contains general information that is not suitable for everyone. Any information contained in this newsletter represents SCM’s opinions, and should not be construed as personalized or individualized investment advice. Past performance is no guarantee of future results. There is no guarantee that the views and opinions expressed in this newsletter will come to pass. Investing in the stock market involves gains and losses and may not be suitable for all investors. Information presented herein is subject to change without notice and should not be considered as a solicitation to buy or sell any security. SCM cannot assess, verify or guarantee the suitability of any particular investment to any particular situation and the reader of this newsletter bears complete responsibility for its own investment research and should seek the advice of a qualified investment professional that provides individualized advice prior to making any investment decisions. All opinions expressed and information and data provided therein are subject to change without notice. SCM, its officers, directors, employees and/or affiliates, may have positions in, and may, from time-to-time make purchases or sales of the securities discussed or mentioned in the publications.
For additional information about SCM, including fees and services, send for our disclosure statement as set forth on Form ADV from SCM using the contact information herein. Please read the disclosure statement carefully before you invest or send money.
This Newsletter and others are available at smeadcap.com
Copyright © Smead Capital Management