


by Corey Hoffstein, Newfound Research
Summary
- Averages are often used to summarize data: but sometimes fitting for the average means fitting nothing at all.
- Expected returns are a meaningful input to portfolio construction, but are unlikely to be the returns actually realized. Reality rarely looks average.
- The world is dynamic and forecasts can change. Not only should we expect that things will not be average, but we should expect that our definition of average will also change.
- We believe that maintaining a degree of flexibility within a portfolio – both with long-term strategic outlooks and short-term tactical tilts – can help investors adapt to the path they are on.
How would you design a cockpit?
Ever thought about it? We haven’t. (Or, at least, until this commentary did not give it much thought.)
But the U.S. Airforce faced this this very problem back in the 1920s. How high should the windshield be? How far should the pedals be from the stick?
Their solution was to measure 100 of their pilots along a number of physical dimensions (e.g. length of their arms, size of their torso, et cetera). Using these figures, they calculated the average for each dimension and used it to guide their design.
By the 1950s, planes had become faster and more mechanically complex. And pilots were losing control of their planes left-and-right.
Military engineers wondered if perhaps the pilots of the 1950s were simply no longer represented by the average from the 1920s. So, they redid the calculations: this time with 4000 pilots and along 140 different physical dimensions.
One scientist – Lt. Gilbert S. Daniels – was skeptical. Perhaps the problem was not with the averages themselves, but with the use of averaging. After all, how many pilots were actually average shaped?
With all the data collected, Daniels took 10 of the primary dimensions and asked a simple question: how many pilots fell within the middle 30% of the range for each of these dimensions? As an example, if the average height of a pilot was 5’9”, how many pilots fell between 5’7” and 5’11”?
How many pilots did Daniels find that fell between this range on all 10 primary dimensions? Zero.
Perhaps that was just too strict a test? What if we chose just 3 of the dimensions? How many pilots fell within the middle 30% of the range for at least 3 dimensions? Just 3.5%.
The cockpits had been designed for an average pilot who simply did not exist. Fitting the average meant fitting no one.[1]
Relying on Expectations
In the last year or so, we’ve spent numerous pages of our commentaries exploring the published expected returns of firms like J.P. Morgan, BlackRock, and Research Affiliates.
We think it is worth pointing out that with these outlooks, expected is just another way of saying average. What they are really saying is, “of the infinite potential futures that could unfold, we believe the average result is X.”
Of course, we do not experience infinite potential futures. We realize just a single one of those future paths. With expected returns for dozens of asset classes, we have to ask: what are the odds that future actually looks average?
To answer this question, we will take a similar approach as Lt. Daniels. First, we use J.P. Morgan’s capital market assumptions to simulate 10,000 possible future 10-year return scenarios.
Using these scenarios, we calculate the range of possible annualized returns for each asset. The graph below then answers the question: what is the probability – assuming J.P. Morgan’s capital market assumptions are true – we see at least N assets within the middle 30% (technically, 35th-65th quantile) band of their realized returns at the same time?
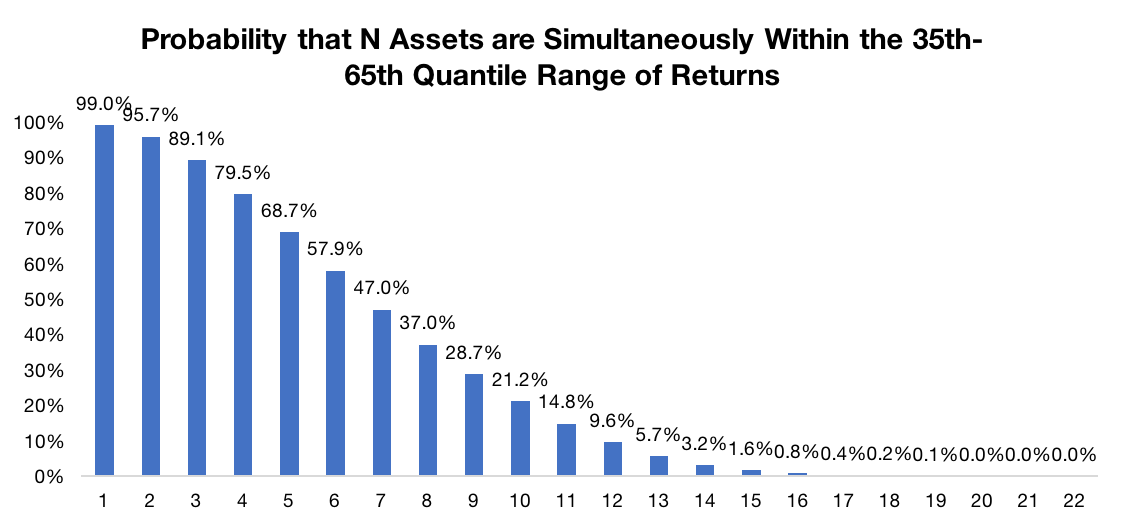
Source: J.P. Morgan. Calculations by Newfound Research.
We can see that there is a 99% chance that at least 1 of the 22 assets will be within the middle 30% band of its range of returns. So something will probably be close to average.
The odds that 50% or more of the 22 assets are simultaneously within the middle 30% of their return range? Just under 15%. Put another way: there is an 85% chance that 50% of the asset returns won’t look average at all.
Expectations and Hurricanes
Last week we read an excellent piece over at RiversHedge, titled On the affinities between hurricanes and retirement[1], a retirement finance blog written by William Selden. William lives in Florida and recounts his first-hand experience with hurricane preparation, the behavioral biases that plague us, and trying to account for the unexpected.
We highly recommend the read.
There is one particular section in the post that we think is worth calling out: “It’s only rarely that a forecast will actually match the real path of a hurricane (or life).”
William presents the following image, which shows the forecasted paths of Irma T-7 days out, T-5 days out, T-1 days out, and the actual path that Irma ended up taking.
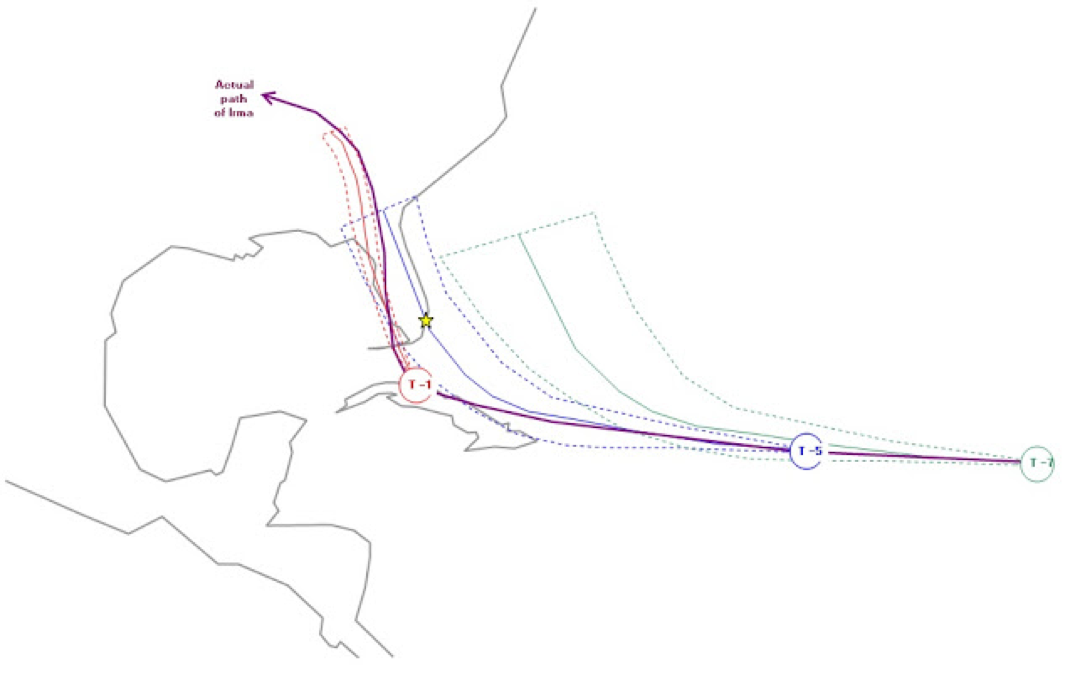
Image Source: RiversHedge
We can see that the path Irma ultimately took from the T-7 forecast was a large outlier. While it remained largely within the T-5 cone, it still came nowhere close to average predicted path. Even by T-1, though the cone of uncertainty was much smaller than T-7, Irma still skirted along the outer edge before moving to the complete opposite side.
A failure of modeling? We’d argue, rather, that it is a reminder that expectations can be misleading in their precision. And, perhaps, the dangers of assuming the expected will happen. A plan designed with information at T-7 could leave you massively unprepared at landfall.
Conclusion
Designing and preparing solely around expectations and averages can be dangerous. Fitting for an average can often mean fitting for nothing at all.
This is, in a way, a curse of portfolio management. Building a portfolio around expectations means that it will ultimately be, in hindsight, sub-optimal for maximizing returns over the path realized.
But we believe that flexibility can be key in helping a portfolio adapt to the path it is on and better avoid the risk of ruin.
With our simulations based upon J.P. Morgan’s capital market assumptions, we saw that the probability of more than 50% of the assets having a return close to their expected return, after 10 years, was less than 15%. In a way, however, that is like asking, “what is the hurricane’s expected path at T-10?” And then being surprised when it does not end up there.
Rather, like hurricane forecasts, we should be constantly updating our outlooks with the new information we have. The expectations we have now may be the best we can do with the information provided, but in several years, we will have learned more about which of the many infinite potential paths we have actually ended up on. And our expectations should be updated accordingly.
As an example of this, we update our long-term strategic assumptions that underlie our QuBe portfolios on a quarterly basis. In many ways, long-term forecasts are akin to trying to always forecast the weather out many months into the future. We likely don’t have any clue if it will snow on Christmas this year, but there is a high probability it will be much colder here in Boston than it was in July. We also believe it is prudent to employ some tactical managers as well, however, who can adapt more quickly. That way, if a week out from Christmas it does look like snow is coming – or if the hurricane changes course at T-1 – we can be prepared.
That does not mean we advocate a fully flexible approach. We believe it is important to accept the limitations of our own forecasting ability and leverage the power of diversification wherever possible. That said, we do believe that owning the same portfolio at the top of the dot-com bubble as the bottom of the 2008 crisis is akin to turning off the weather station when hurricane season rolls around.
[1] The source of this story: https://www.thestar.com/news/insight/2016/01/16/when-us-air-force-discovered-the-flaw-of-averages.html
[2] https://rivershedge.blogspot.com/2017/09/on-affinity-between-hurricanes-and.html
Copyright © Newfound Research