


JULY 2017 A feature article from our U.S. partners
Will the Markets’ Fairy Tale Year Have a Happy Ending?
2017 has been a Goldilocks year so far, with stocks and bonds up amid record-low volatility. But 2018 could be a different story.
by Jurrien Timmer, Director of Global Macro, @TimmerFidelity, Fidelity Investments
Key Takeaways
• Investors have enjoyed the best of both worlds this year, with stocks and bonds rallying together amid record-low volatility.
• Non-U.S. equities (led by Europe) have outperformed domestic stocks so far, which may be part of a larger mean reversion.
• One looming concern is a disconnect on monetary policy, with the Fed penciling in seven more rate hikes in the next two years versus the market’s expectation for one or two.
• The aftermath of China’s massive reflation is another critical piece of the puzzle, given its role in fueling the global business cycle.
• The FANG trade (an acronym representing four popular technology stocks) has received a lot of attention lately, prompting comparisons to the 2000 tech bubble; however, the fundamentals
Download PDF
The year so far
At the beginning of each year when strategists produce their annual outlooks, the consensus is often wrong. For example, following the U.S. election seven months ago, the overwhelming consensus was for a fiscal-policy.induced pickup in consumer confidence, accompanied by policy-induced volatility. Coming so late in the cycle, the fiscal boost was expected to create an environment for higher inflation, higher interest rates, and a stronger
U.S. dollar. The thinking was also that the more policy- sensitive small-cap stocks would outperform large-caps. All of this may well still happen, if and when we do get fiscal policy changes. But very little has happened on the policy front so far and expectations are low for anything substantive anytime soon. As a result, the JP Morgan Trade Weighted U.S. Dollar Index is down 5% year to date (YTD),1 the 10-year Treasury yield is down to 2.15%, and the small-cap Russell 2000® Index is trailing larger-cap benchmarks. Meanwhile, inflation has been all but missing in action, with the core PCE rate2 (the Federal Reserve’s favorite inflation barometer) falling to 1.5% year over year. for tech stocks are anything but dangerous.
This has resulted in a sharp and unexpected de-rating of inflation expectations. Amid this unwinding of the “Trump trade,” there has been a significant rotation out of small-caps, financials, and value stocks and into the technology sector, especially the FANG stocks (an acronym representing four popular technology stocks). This has caused some people to make comparisons to the tech bubble in 2000. But these concerns seem misplaced. While tech prices have soared (until some air was let out a few weeks ago), the sector today comprises about 21% of the stock market’s capitalization,3 whereas in March 2000 it was roughly 35%. Also, the trailing price-to-earnings (P/E) ratio for tech is currently only 20x. In 2000, its P/E reached 71x!4
I think of market leadership not so much in terms of the 11 market sectors, but more in terms of three themes or regimes: cyclical growth (financials, industrials, energy, small-caps), secular growth (stocks that grow strongly regardless of the business cycle), and income-oriented (the so-called “bond proxies,” or stocks that take their cues from bond yields). Each of these buckets has led the market at some point in recent years, and I think the rotation from one to the other is healthy and normal. I for one am not concerned about a perceived “FANG bubble,” especially now that their advance has paused.
Meanwhile, China continues to fuel the global economy through its massive credit expansion, and in Europe the positive outcome of the French election gave a much-needed boost to the euro. These events have helped foreign equities shine so far this year, with the MSCI EAFE Index (non-U.S. developed) up 14% YTD and the MSCI Emerging Markets Index up almost 18%. The S&P 500 has gained a respectable 10%, but is well behind the rest of the world. After five years of neglect, international stocks are finally in the sweet spot, because they are producing strong earnings growth from a low-valuation starting point.
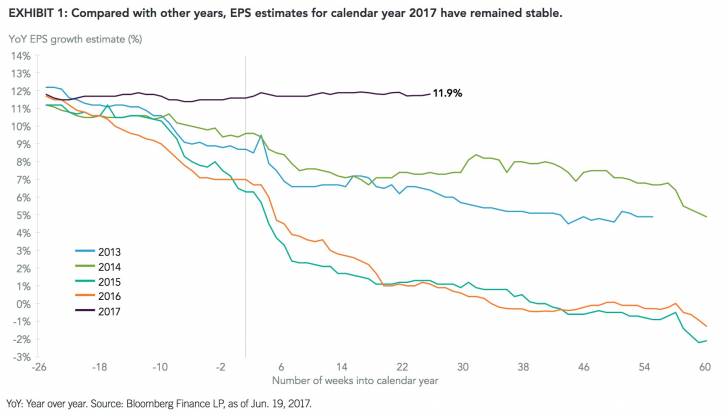
Still, the global cycle’s ongoing expansion has lifted earnings growth in the United States. Earnings estimates in Q1 and so far in Q2 have outpaced their normal seasonal drift. Q1 earnings per share (EPS) for the S&P 500 was up 14% from a year ago. Granted, that’s against easy comparisons, since a year ago earnings were at the bottom of the cycle. So far, Q2 estimates are holding steady at about 7% year over year, and the calendar-year 2017 EPS estimate is maintaining a 12% growth rate.
Normally, by this point the estimate progression would have fallen considerably. That’s because estimates typically start too high, and then drift lower until the start of each quarterly earnings season (see Exhibit 1, page 2). But 2017 has been an anomaly. As shown in the chart, EPS estimates for 2017 started out high (around 12%) and have remained there. I believe this is because we are coming out of an industrials and energy earnings recession, which by definition implies a stronger-than.average growth rate. Therefore, there is less downward drift than normal. Either way, it’s a bullish sign because it shows that earnings estimates are not too inflated. This robust earnings backdrop has allowed the U.S. stock market to remain somewhat overvalued at 21x trailing earnings (roughly 18x expected EPS). Without a negative catalyst, valuations can remain elevated for some time.
The Fed has raised rates twice already this year and now for three quarters in a row—something that seemed unthinkable a year ago. Still, the U.S. dollar and bond yields are down while financial conditions continue to improve. This is somewhat unusual (generally, Fed tightening causes financial conditions to tighten), and is a testament to the fact that rates remain very low and the economy is healthy enough to endure a series of rate hikes from the zero rate environment. To the Fed’s credit, it is only going as fast as the markets will allow.
It is very important for investors to recognize that rate hikes (at least early in the Fed cycle) can be easily absorbed when earnings growth is robust, as it is now.
It’s when earnings are contracting that Fed tightening can cause problems, as happened in 2015. Just compare the current backdrop to two years ago when the Fed could barely get its first hike out of the way. Remember the market havoc created by the unexpected devaluation of the Chinese currency in August 2015? But things are different now, and the Fed is taking full advantage of its free option to normalize policy.
With stocks up, rates down, credit spreads tight and the U.S. dollar weaker, financial conditions have remained consistently favorable. This more than anything may be responsible for the record-low volatility so far this year, despite the considerable policy uncertainty that investors face. Since the February 2016 market bottom, the S&P 500 is up 28%, but its “vol” (standard deviation of returns) is a mere 7%. Contrast that with the index’s historical return of 10% and its volatility of 15%, and it’s clear why investors might be getting a little spoiled.
Looking forward
The Goldilocks scenario raises the question of how much longer the combination of outsized gains and ultra-low volatility can continue. And when will mean reversion kick in, as it usually does? It’s impossible to know, of course, but it’s worth thinking about possible risks as we head into the second half of 2017.
For me, the two principal risks that could threaten the Goldilocks regime are:
1. The Fed raises rates much more than the market expects.
2. China has a hard landing in the aftermath of its credit impulse. In my view, neither of these risks is imminent but they could become more important as we approach 2018. As for monetary policy, so far the market and the Fed have been on the same page. But starting next year a large disconnect could occur. The market (via the Fed funds forward curve) is pricing in less than two more hikes over the coming two years, but the Fed seems to be penciling in seven more, according to its so-called dot plot. The Fed’s dots indicate one more hike this year, three more next year, and three more in 2019.
Granted, the Fed will soon use its balance sheet as a policy tool, and it probably considers balance-sheet reduction as the equivalent of at least a few of the future rate hikes. Nevertheless, either the Fed governors need to bring their dots down (the typical pattern in recent years) or the market needs to price in more hikes. If the latter, it’s plausible the U.S. dollar strengthens, bond yields rise, and financial conditions tighten. That may or may not upset the stock market depending on where earnings are at the time, but it is clearly a risk for 2018 and 2019.
China’s performance will come down to the government’s ability to engineer a soft landing following its massive credit impulse (which amounted to 30% of new credit as a percentage of GDP being added, according to Bloomberg). So far, policymakers seem to have a good handle on things; tightening policy just enough to prevent an overheating but no so much that it causes a hard landing. Currency reserves seem to be holding steady and the yuan has been gaining ground lately (again, a consequence of a weaker U.S. dollar and benign financial conditions). But it’s a delicate balance and something to keep a close eye on as we approach 2018 post the November Party Congress.
All in all, at this point I don’t see anything on the immediate horizon that could threaten the Goldilocks market, at least nothing that is clearly quantifiable (geopolitical shocks are always possible but very difficult to predict). But volatility is mean-reverting in nature (just like valuation and earnings growth) and we need to be prepared that at some point in the months ahead we will see that mean reversion kick in.
As a result, it is more important than ever to be properly diversified between assets that are risk-on (stocks, credit, commodities) and risk-off (bonds). I continue to believe (as I have all year) that non-U.S. equities (especially emerging markets and Europe) provide excellent risk-reward given their attractive valuations and positive growth dynamics, especially following a five-year period (2011–2016) in which they lagged some 140 percentage points behind the U.S.
*****
Authors
Jurrien Timmer | Director of Global Macro, Fidelity Global Asset Allocation Division
Jurrien Timmer is the director of Global Macro for the Global Asset Allocation Division of Fidelity Investments, specializing in global macro strategy and tactical asset allocation. He joined Fidelity in 1995 as a technical research analyst.
Fidelity Thought Leadership Vice President Matt Bennett pro.vided editorial direction for this article.
For Canadian investors
For Canadian prospects and/or Canadian institutional investors only. Offered in each province of Canada by Fidelity Investments Canada ULC in accordance with applicable securities laws.
Endnotes
1 As of June 20, 2017.
2 The “core” PCE (personal consumption expenditures) price index is defined as prices excluding food and energy prices. The PCE measures the prices paid by consumers for goods and services without the volatility caused by movements in food and energy prices to reveal underlying inflation trends.
3 Source: S&P Dow Jones Indices.
4 Source: Bloomberg Finance LP, as of Jun. 20, 2017.
Before investing in any mutual fund, please carefully consider the investment objectives, risks, charges, and expenses. For this and other information, contact Fidelity for a free prospectus or, if available, a summary prospectus. Please read it carefully.
Unless otherwise disclosed to you, in providing this information, Fidelity is not undertaking to provide impartial investment advice, or to give advice in a fiduciary capacity, in connection with any investment or transaction described herein. Fiduciaries are solely responsible for exercising independent judgment in evaluating any transaction(s) and are assumed to be capable of evaluating investment risks independently, both in general and with regard to particular transactions and investment strategies. Fidelity has a financial interest in any transaction(s) that fiduciaries, and if applicable, their clients, may enter into involving Fidelity’s products or services.
Information presented herein is for discussion and illustrative purposes only and is not a recommendation or an offer or solicitation to buy or sell any securities. Views expressed are as of the date indicated, based on the information available at that time, and may change based on market and other conditions. Unless otherwise noted, the opinions provided are those of the author and not necessarily those of Fidelity Investments or its affiliates. Fidelity does not assume any duty to update any of the information.
Investment decisions should be based on an individual’s own goals, time horizon, and tolerance for risk. Nothing in this content should be considered to be legal or tax advice and you are encouraged to consult your own lawyer, accountant, or other advisor before making any financial decision.
Stock markets, especially non-U.S. markets, are volatile and can decline significantly in response to adverse issuer, political, regulatory, market, or economic developments. Foreign securities are subject to interest rate, currency exchange rate, economic, and political risks, all of which are magnified in emerging markets.
Investing involves risk, including risk of loss.
Past performance is no guarantee of future results.
Diversification and asset allocation do not ensure a profit or guarantee against loss.
All indexes are unmanaged. You cannot invest directly in an index.
Index definitions
Standard & Poor’s 500 (S&P 500®) Index is a market capitalization-weighted index of 500 common stocks chosen for market size, liquidity, and industry group representation to represent U.S. equity performance. S&P 500 is a registered service mark of The McGraw-Hill Companies, Inc., and has been licensed for use by Fidelity Distributors Corporation and its affiliates.
Russell 2000® Index is a market capitalization-weighted index designed to measure the performance of the small-cap segment of the U.S. equity market.
MSCI Europe, Australasia, Far East Index (EAFE) is a market capitalization-weighted index that is designed to measure the investable equity market performance for global investors in developed markets, excluding the U.S. & Canada.
MSCI Emerging Markets (EM) Index is a market capitalization-weighted index designed to measure the investable equity market performance for global investors in emerging markets.
JP Morgan Trade Weighted U.S. Dollar Index is a weighted average of the foreign exchange value of the U.S. dollar against the currencies of a broad group of major U.S. trading partners.
Third-party marks are the property of their respective owners; all other marks are the property of Fidelity Investments Canada ULC.
If receiving this piece through your relationship with Fidelity Institutional Asset Management® (FIAM), this publication may be provided by Fidelity Investments Institutional Services Company, Inc., Fidelity Institutional Asset Management Trust Company, or FIAM LLC, depending on your relationship.
If receiving this piece through your relationship with Fidelity Personal & Workplace Investing (PWI) or Fidelity Family Office Services (FFOS), this publication is provided through Fidelity Brokerage Services LLC, Member NYSE, SIPC.
If receiving this piece through your relationship with Fidelity Clearing and Custody Solutions or Fidelity Capital Markets, this publication is for institutional investor or investment professional use only. Clearing, custody or other brokerage services are provided through National Financial Services LLC or Fidelity Brokerage Services LLC, Members NYSE, SIPC.