by Ryan Detrick, LPL Research
European equities had a huge day yesterday, as the French election eased fears over anti-euro concerns. How historic was the day?
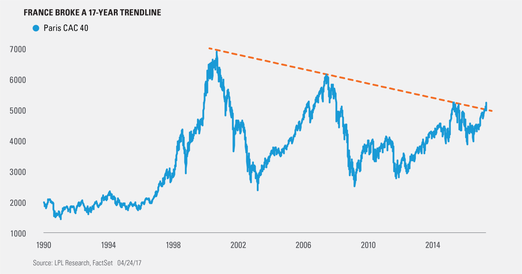
- The Paris CAC 40 Index gained 4.1% for its first >4% gain since August 2015.
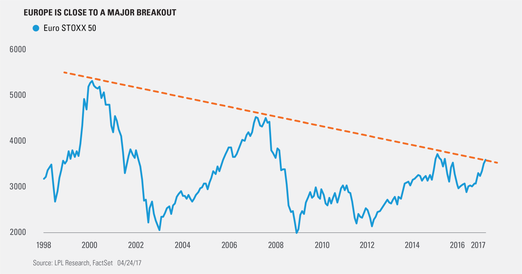
- The Euro STOXX 50 Index gained 4.0% for its best daily gain since August 2015.
- The S&P 500 Index gained more than 1% for the first time since March 1, 2017, and it was only its second 1% gain this year.
- Volatility imploded, as the CBOE Volatility Index (VIX) sank 25.9% for its largest one-day drop since August 2011. Going back to 1990, this was the fourth-largest one-day percentage drop ever.
We took a technical look at European markets in early December and noted things were looking potentially bullish. After yesterday’s big gains, markets continue to advance. In fact, most European markets are now outpacing U.S. markets year to date.
Per Ryan Detrick, Senior Market Strategist, “One chart that could bode well for European markets, and likely for global markets in general, is the Paris CAC 40. It didn’t just break a bearish trendline going back 17 years yesterday; it blew the doors off the trendline. This is a picture-perfect breakout and one that should bode well for future gains.”
What about European equities in general? The London FTSE Index breakout earlier this year and Paris CAC 40 breakout are both major positives, but the Euro STOXX 50 still has a little work to do before it breaks out. This trendline won’t go down without a fight, but should the Euro STOXX 50 move above the trendline, it could be an even better sign for continued European strength.
We are only focusing on technicals here, and that is just part of the story. For more on our thoughts on Europe, be sure to read this week’s Weekly Market Commentary: Europe Enters The Tour De France.
*****
IMPORTANT DISCLOSURES
Past performance is no guarantee of future results. All indexes are unmanaged and cannot be invested into directly.
The opinions voiced in this material are for general information only and are not intended to provide or be construed as providing specific investment advice or recommendations for any individual security.
The economic forecasts set forth in the presentation may not develop as predicted.
Investing in stock includes numerous specific risks including: the fluctuation of dividend, loss of principal and potential illiquidity of the investment in a falling market.
Stock investing involves risk including loss of principal.
Investing in foreign and emerging markets securities involves special additional risks. These risks include, but are not limited to, currency risk, geopolitical risk, and risk associated with varying accounting standards. Investing in emerging markets may accentuate these risks.
The Standard & Poor’s 500 Index is a capitalization-weighted index of 500 stocks designed to measure performance of the broad domestic economy through changes in the aggregate market value of 500 stocks representing all major industries.
The CAC 40 is a capitalization-weighted index of the 40 largest French equities designed to measure the overall performance of the Paris Bourse, the French stock exchange.
The EURO STOXX 50 Index is a blue-chip index for the Eurozone, which covers 50 stocks from 12 Eurozone countries: Austria, Belgium, Finland, France, Germany, Greece, Ireland, Italy, Luxembourg, the Netherlands, Portugal, and Spain.
The VIX is a measure of the volatility implied in the prices of options contracts for the S&P 500. It is a market-based estimate of future volatility. When sentiment reaches one extreme or the other, the market typically reverses course. While this is not necessarily predictive, it does measure the current degree of fear present in the stock market.
The FTSE 100 is an index of blue-chip stocks on the London Stock Exchange.
Because of their narrow focus, specialty sector investing, such as healthcare, financials, or energy, will be subject to greater volatility than investing more broadly across many sectors and companies.
This research material has been prepared by LPL Financial LLC.
To the extent you are receiving investment advice from a separately registered independent investment advisor, please note that LPL Financial LLC is not an affiliate of and makes no representation with respect to such entity.
Not FDIC/NCUA Insured | Not Bank/Credit Union Guaranteed | May Lose Value | Not Guaranteed by any Government Agency | Not a Bank/Credit Union Deposit
Securities and Advisory services offered through LPL Financial LLC, a Registered Investment Advisor Member FINRA/SIPC
Tracking # 1-602571 (Exp. 4/18)
Copyright © LPL Research


