
Technically Speaking: When Bulls Collide
by Lance Roberts, Clarity Financial
Prior to the election last year, I penned an article entitled “2400 or Bust” which discussed the potential for a market “melt-up” at that time. To wit:
“As shown below, the current price action continues to consolidate in a very tight range which will resolve itself in very short order. A breakout to the upside will clear the markets for a further advance. However, while the technicals suggest a move to 2400, it is quite possible it could be much less. Notice in the bottom section of the chart below. Turning the current ‘sell signal’ back into a ‘buy signal’ at such a high level does not give the markets a tremendous amount of runway.”
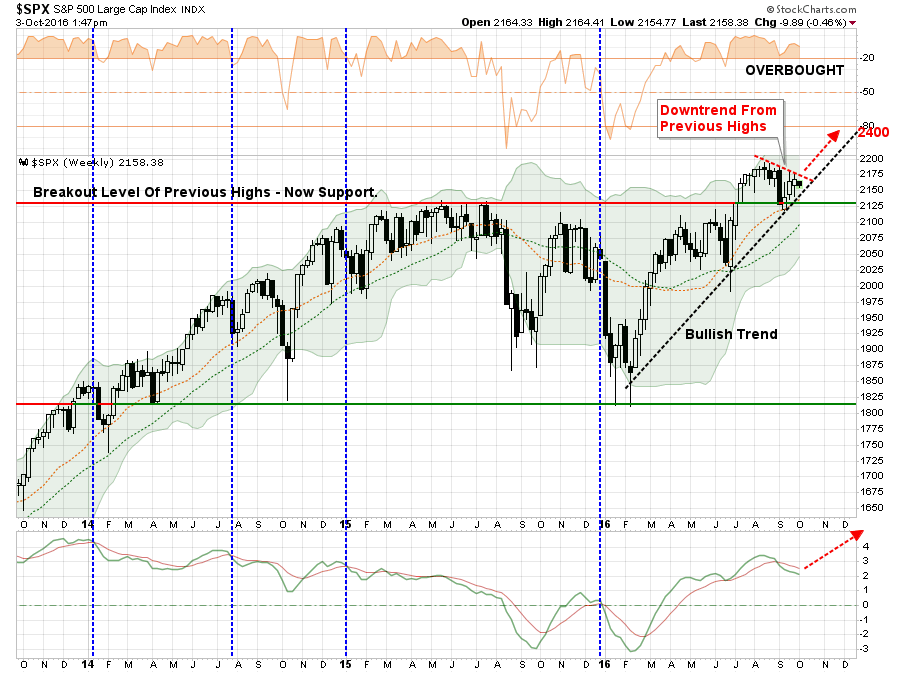
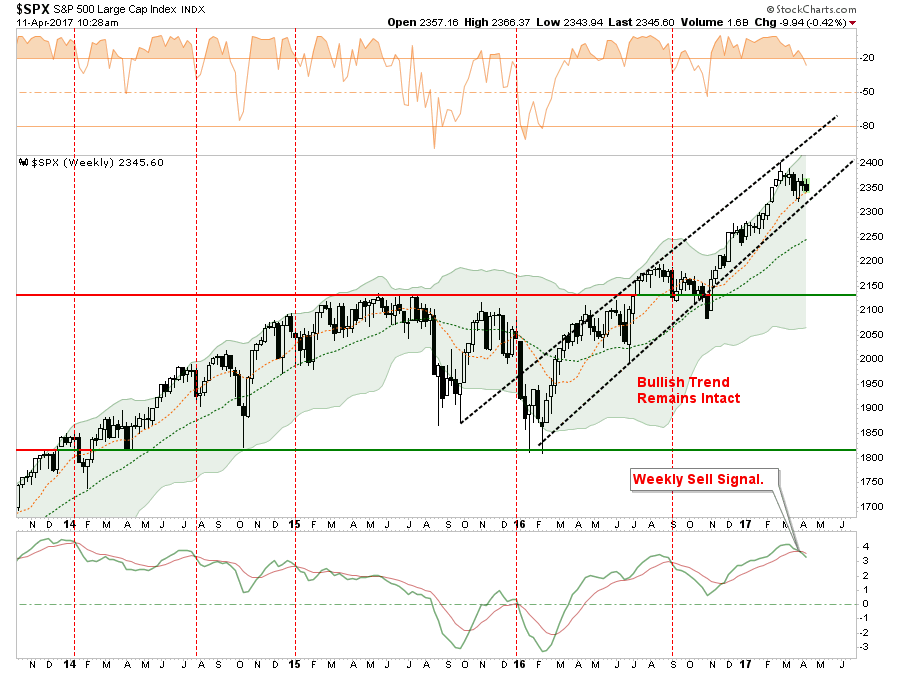
Of course, since then the market has completed the majority of that advance. I have updated that chart below through Tuesday’s open.
Despite rising geopolitical tensions in the Middle East, the deployment of the USS Carl Vinson strike group off the coast of the Korean peninsula, or the looming potential of a Government shutdown over a “debt ceiling” fight, nothing seems to concern the markets much.
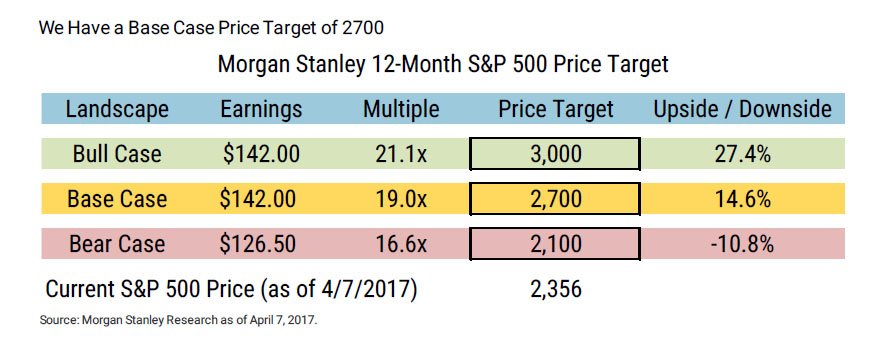
The market remains in a bullish trend and short-term moving averages continue to provide support against a deeper correction. At the same time, complacency remains high leading to Wall Street pushing estimates ever higher. In fact, you don’t have to go far to find the bullish case now being made for S&P 2700-3000 as per Morgan Stanley:
“The cyclical upturn that began a year ago has less to do with President Trump and more to do with the global business cycle that bottomed in 1Q-2016. Trump simply ‘turbocharged’ the cycle and stoked animal spirits on Wall and Main Street, with tangible effects on the real economy and markets. The title of our year-ahead outlook as CIO for Morgan Stanley Wealth Management on January 1st was ‘Are You Ready for Euphoria?’– based on Sir John Templeton’s four stages of the investment cycle:
‘Bull markets are born in pessimism, grow in skepticism, mature in optimism and die in euphoria.’
The end of the cycle is often the best. Think 1999 or 2006-07. In a low-return world, investors cannot afford to miss it.”
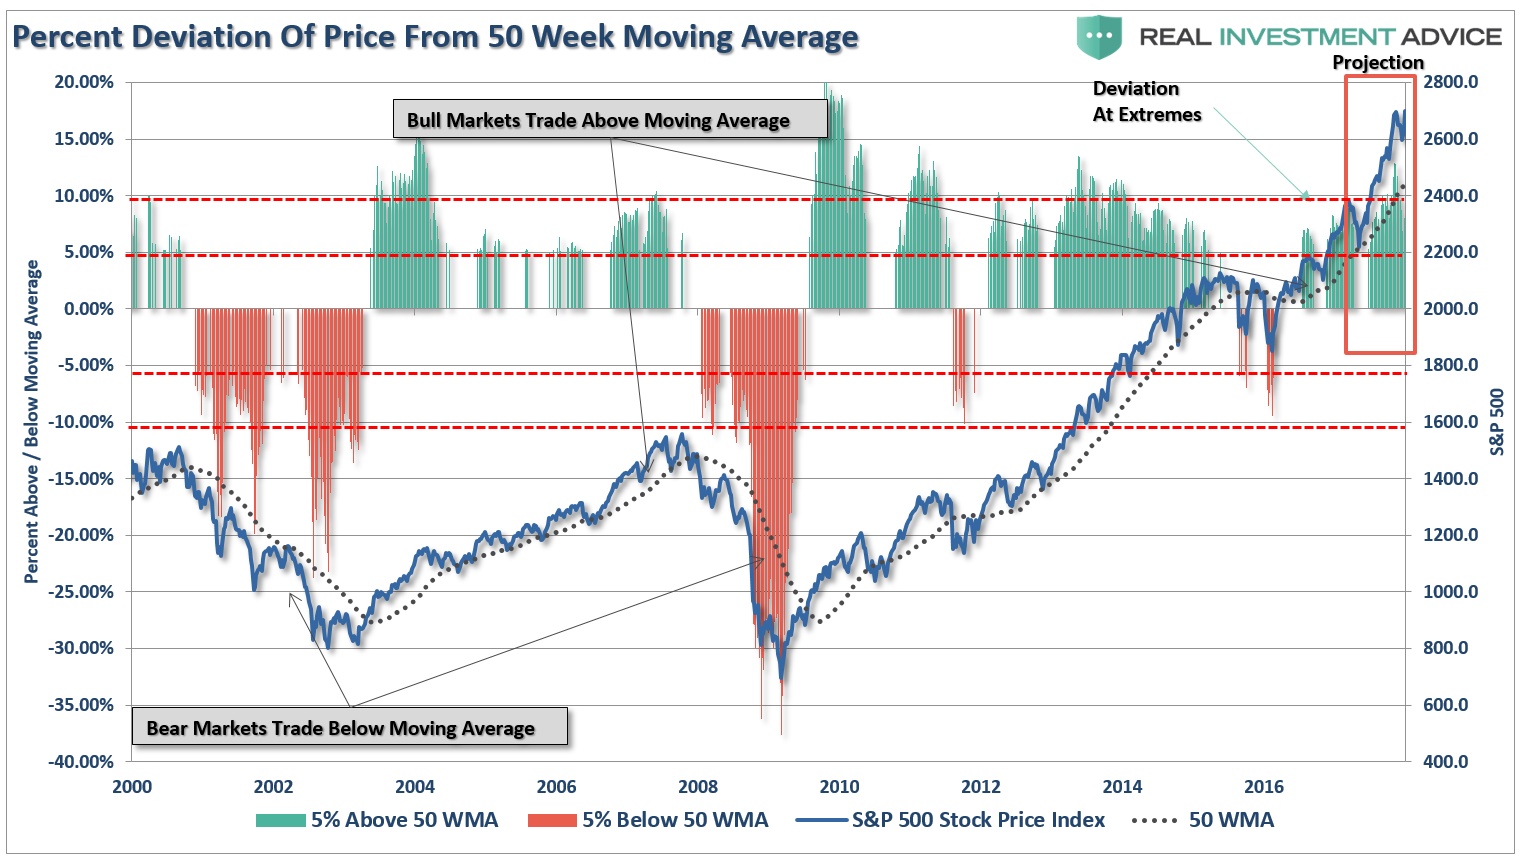
The chart below projects the move to 2700 from current levels as “euphoria” takes hold. (A move to 3000, as suggested, would only exacerbate the deviation.) The data in the orange box is an extrapolated price advance using historical market data. The dashed black line is the 50-week moving average (because #BlackLinesMatter) and the bar chart is the deviation of the markets from price average.
Here’s the problem.
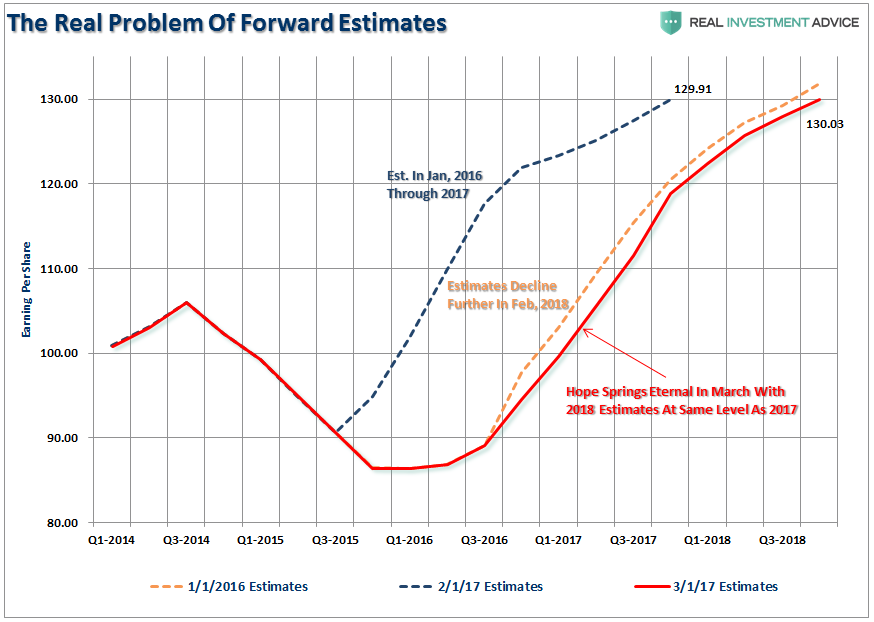
As I discussed recently, the predicted surge in earnings was based upon corporate tax reform which would boost bottom lines earnings per share.
“The expectations of a $1.31 boost to earnings for each percentage point of reduction in tax rates is also a bit ‘squishy.’ The premise WAS based on the expected earnings in 2017 of $131.00 for the entirety of the S&P 500. The $1.31 increase is simply 1% of $131.00 in total operating earnings.
Since actual earnings for 2016 was $94.54/share, this implies a $0.9454 increase per point, or an earnings boost of $18.91 (.9454 * 20) at best which would bring total 2017 estimates to $113.45. This is $5.38 less than what is currently estimated for 2017 and brings into serious question of 2018 estimates of $130.03.
Based on this math, forward valuations (assuming prices don’t move from yesterday’s close) would be 20.63x. This is far more expensive than the 17x earnings expected previously. But unfortunately, the news is already getting worse as estimates have continued to slide just in the last month.”
Here’s the problem.
While Morgan Stanley is suggesting earnings will rocket higher to $142/share in the next 12-months to support the ongoing bullish advance to 2700, the catalyst for that surge has been put “on hold” for now with the “tax plan agenda” scrapped,
While there is little doubt that “bullish hopes” certainly remain, it is worth noting (in the second chart above) the market has issued a weekly “sell signal” from a high level which has previously preceded temporary weakness in the market. Given the current extension above the longer-term moving average (green dashed line,) a correction to 2250 currently would be consistent with previous corrections following a similar sell signal. While such a correction would only be roughly -4.4%, it would not only wipe out all of the gains of the year so far, but would also “feel” much worse given the currently high levels of investor complacency.
Bond Bulls Emerge
The most interesting note as of late has been the quiet death of the “bond bears.”
Back in January, as the 10-year Treasury rate pushed towards 2.6% based on the coming reflationary resurgence of inflation and economic growth from the “Trump Agenda,” Wall Street trumpeted the “death of bonds.”
This is an argument I have continued to debunk since June 2013 but most recently in August of last year.
“There is an assumption that because interest rates are low, that the bond bull market has come to its inevitable conclusion. The problem with this assumption is three-fold:
- All interest rates are relative. With more than $10-Trillion in debt globally sporting negative interest rates, the assumption that rates in the U.S. are about to spike higher is likely wrong. Higher yields in U.S. debt attracts flows of capital from countries with negative yields which push rates lower in the U.S. Given the current push by Central Banks globally to suppress interest rates to keep nascent economic growth going, an eventual zero-yield on U.S. debt is not unrealistic.
- The coming budget deficit balloon. Given the lack of fiscal policy controls in Washington, and promises of continued largess in the future, the budget deficit is set to swell back to $1 Trillion or more in the coming years. This will require more government bond issuance to fund future expenditures which will be magnified during the next recessionary spat as tax revenue falls.
- Central Banks will continue to be a buyer of bonds to maintain the current status quo, but will become more aggressive buyers during the next recession. The next QE program by the Fed to offset the next economic recession will likely be $2-4 Trillion which will push the 10-year yield towards zero.”
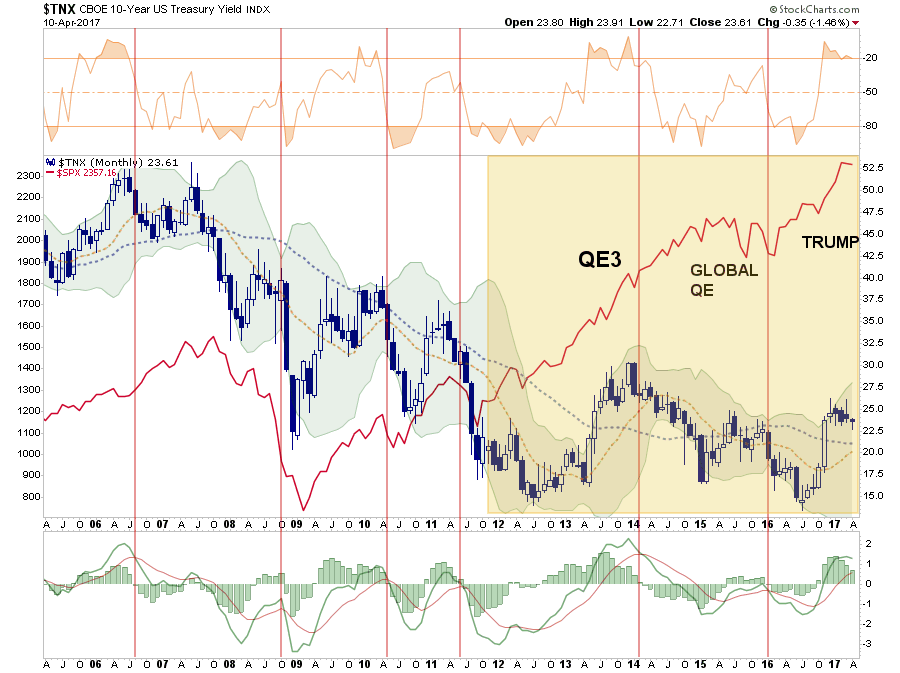
Not surprisingly, as the current administration continues to fumble economic policy agendas, the rotation out of the “Trump Trade” back into “safety” has picked up steam. As shown below, interest rates have now triggered a “weekly sell signal,” or more notably, a “weekly buy signal” for bonds.

A break below support at 2.3%, which will likely coincide with any type of “debt ceiling” showdown, will likely push rates back towards 2% or lower. Importantly, the rotation from the “reflation trade” back into the “risk-off trade” suggests a loss of confidence in the potential for fiscal policy reforms. As noted by John Mason recently:
“More slow economic growth? That is what the bond market seems to be saying about the future growth of the US economy.”
Of course, with 2016 GDP slipping to just 1.6% annual growth and Q1-2017 targeted to just 0.6% currently, there is little ability for interest rates to move substantially higher. This is particularly the case with consumers currently facing a severe shortfall between wage growth and their current cost of living.
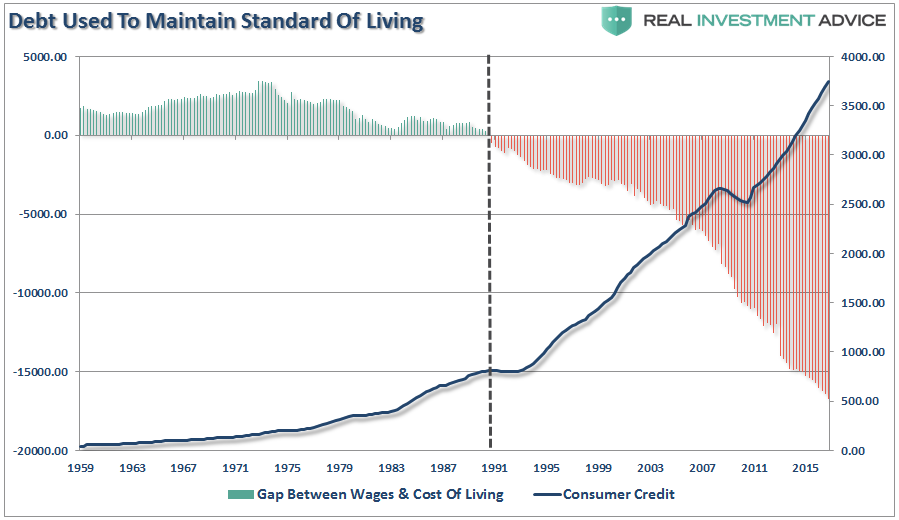
At current levels, even small changes to borrowing rates can have a very quick adverse effect on the 70% of the economy that borrows money to maintain their standard of living.
When Bulls Collide
So, with this backdrop of weakening underpinnings of the “Trump Trade” but exuberant hopes of a continued bull market run comes the potential collision between markets.
It is highly unlikely that bond bulls and stock bulls will both be right.
One thing is true, as shown below, prior to 2012, the direction of rates closely dictated the moves of the equity markets. However, as the BOJ, BOC, BOE, ECB and the FED engaged in massive liquidity programs in an attempt to spark inflation pressures and economic growth, as shown below, the markets became somewhat detached from the message bonds were sending. With the Fed now hiking rates and tightening monetary policy, it is quite likely bonds are once again signaling a warning to stock investors.
This detachment between fundamentals and monetary policy has also driven the stock/bond ratio to historical heights which has previously not ended well for stock investors. More importantly, the acceleration of the ratio should also raise an alarm.
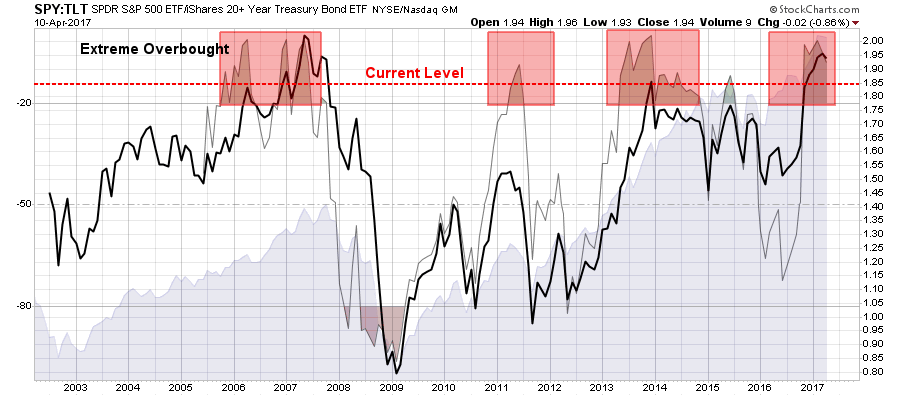
As noted by GaveKal recently:
“Over short periods of time, the relative performance of stocks and bonds fluctuates around a mean of about zero. When stocks outperform bonds by a large amount over a short period, that period of outperformance reverts back towards zero, either through time or performance. While we can’t possibly predict the performance of either stocks or bonds, what we can fairly confidently deduce is that further stock strength relative to bonds is unlikely over the coming months.”
This is a very good point and my suspicion is that he will be right.
So, while I am still bullish on the markets short-term (few days to weeks), I am becoming much more cautious. Over the longer-term (few weeks to several months), I am much more bearish.
Hedging risk continues to remain a prudent course of action.
*****
Lance Roberts

Lance Roberts is a Chief Portfolio Strategist/Economist for Clarity Financial. He is also the host of “The Lance Roberts Show” and Chief Editor of the “Real Investment Advice” website and author of “Real Investment Daily” blog and “Real Investment Report“. Follow Lance on Facebook, Twitter and Linked-In
Copyright © Clarity Financial