
by Lance Roberts, Clarity Financial
I thought the following quote from Janet Yellen’s Q&A at the University Of Michigan this week was interesting regarding the lessons I thought were learned from the financial crisis.
“First, we supervise banking organizations and some other financial enterprises to make sure that they operate in a safe and sound fashion. Second, we monitor potential threats to financial stability. We certainly don’t want to have another financial crisis and we want to redress threats in the environment that could lead to one. We had a system in which banking organizations were not monitoring and controlling risk appropriately. They had too much capital and were overleveraged.”
Silly me.
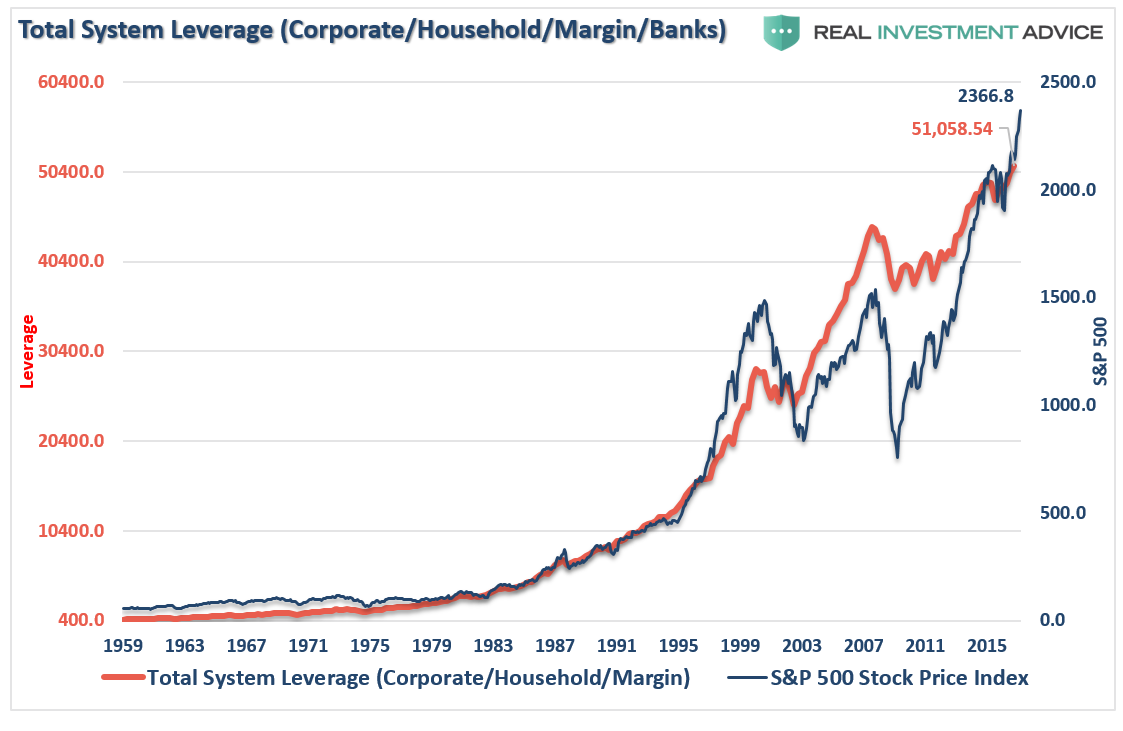
While talk is cheap, the reality is the Federal Reserve fostered another surge in leverage by promoting and maintaining “accommodative” policies for far too long. The chart below is the aggregate of corporate, consumer, margin and banking debt in billions. I have excluded governmental debt so we can focus on the leverage in the economy. I have added GDP for comparative purposes.
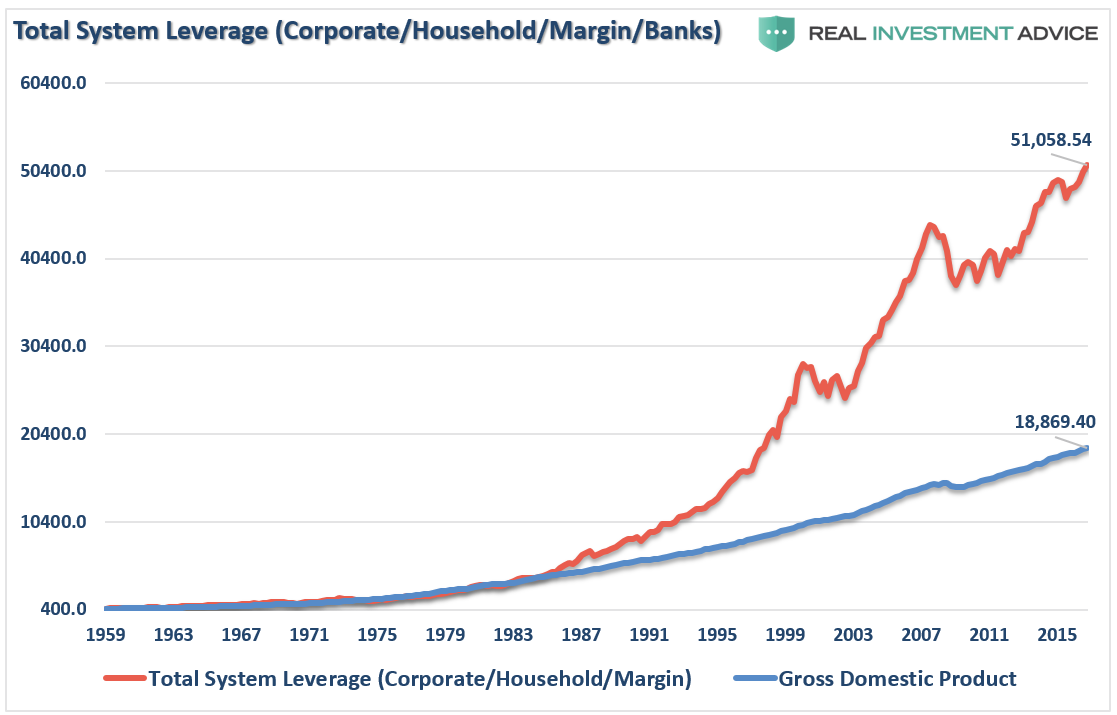
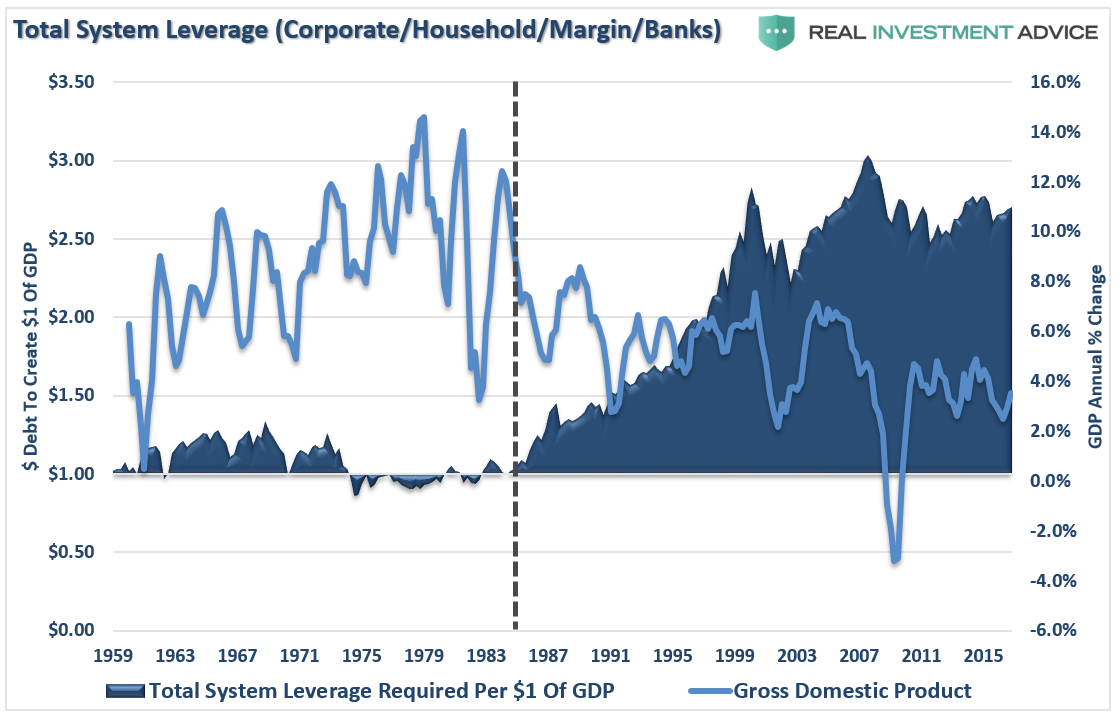
It is worth noting that from 1959 to 1983, it required roughly $1 of debt to create $1 of economic activity. However, as I have discussed previously, the deregulation of the financial sector, combined with falling interest rates, led to a debt explosion. As shown below this debt explosion, which allowed for an excessive standard of living, has led to the long-term deterioration in economic growth rates.
If we add governmental debt, student loan debt, and entitlements into the equation, the problem gets far worse.
However, the point I want to address here is the level of debt in the system which has once again reached new records since the financial crisis.
What could possibly go wrong this time?
There is an inherent belief that corporate and bank balance sheets are in much better shape today than they were in 2007. While I will not argue that banks are indeed on better footing, the repeal of FASB Rule 157 allowed banks to “mark assets to fantasy,” which vastly improved their balance sheet health.
The question that should be asked of Ms. Yellen is simply:
“After trillions in various bailouts of the financial system, and claims the ‘health’ of the financial system is good, why does FASB Rule 157 still remain repealed?”
The answer is simple. The “health” of the financial system may not be as strong as advertised.
But I digress.
As debt levels increase, the servicing of that debt diverts capital from productive investment. Furthermore, the use of debt as it relates to “current” consumption, which is 70% of economic growth, is “future” consumption denied.
In other words, individuals use debt to pull “forward” consumption which leaves a “void” in the future. However, since “debt accumulation” is “finite,” there is a point to where excess debt is resolved through default, write off, or bankruptcy as witnessed during the “financial crisis.”
It is this accumulation of debt which has provided a dangerous illusion of liquidity.
But it may be showing signs of coming to an end.
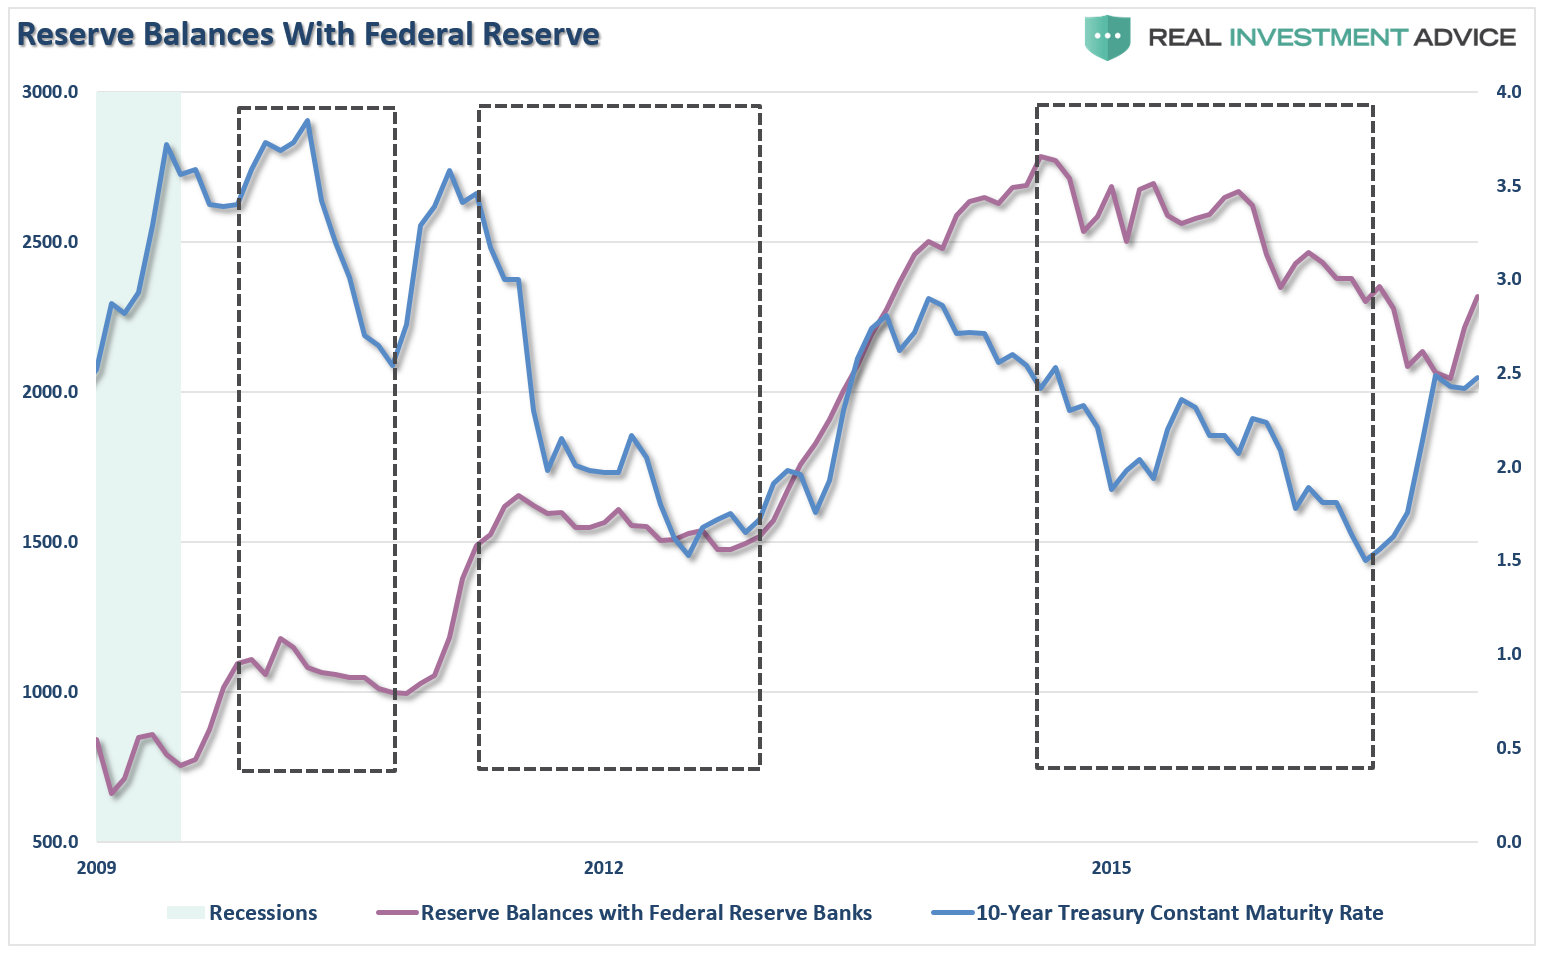
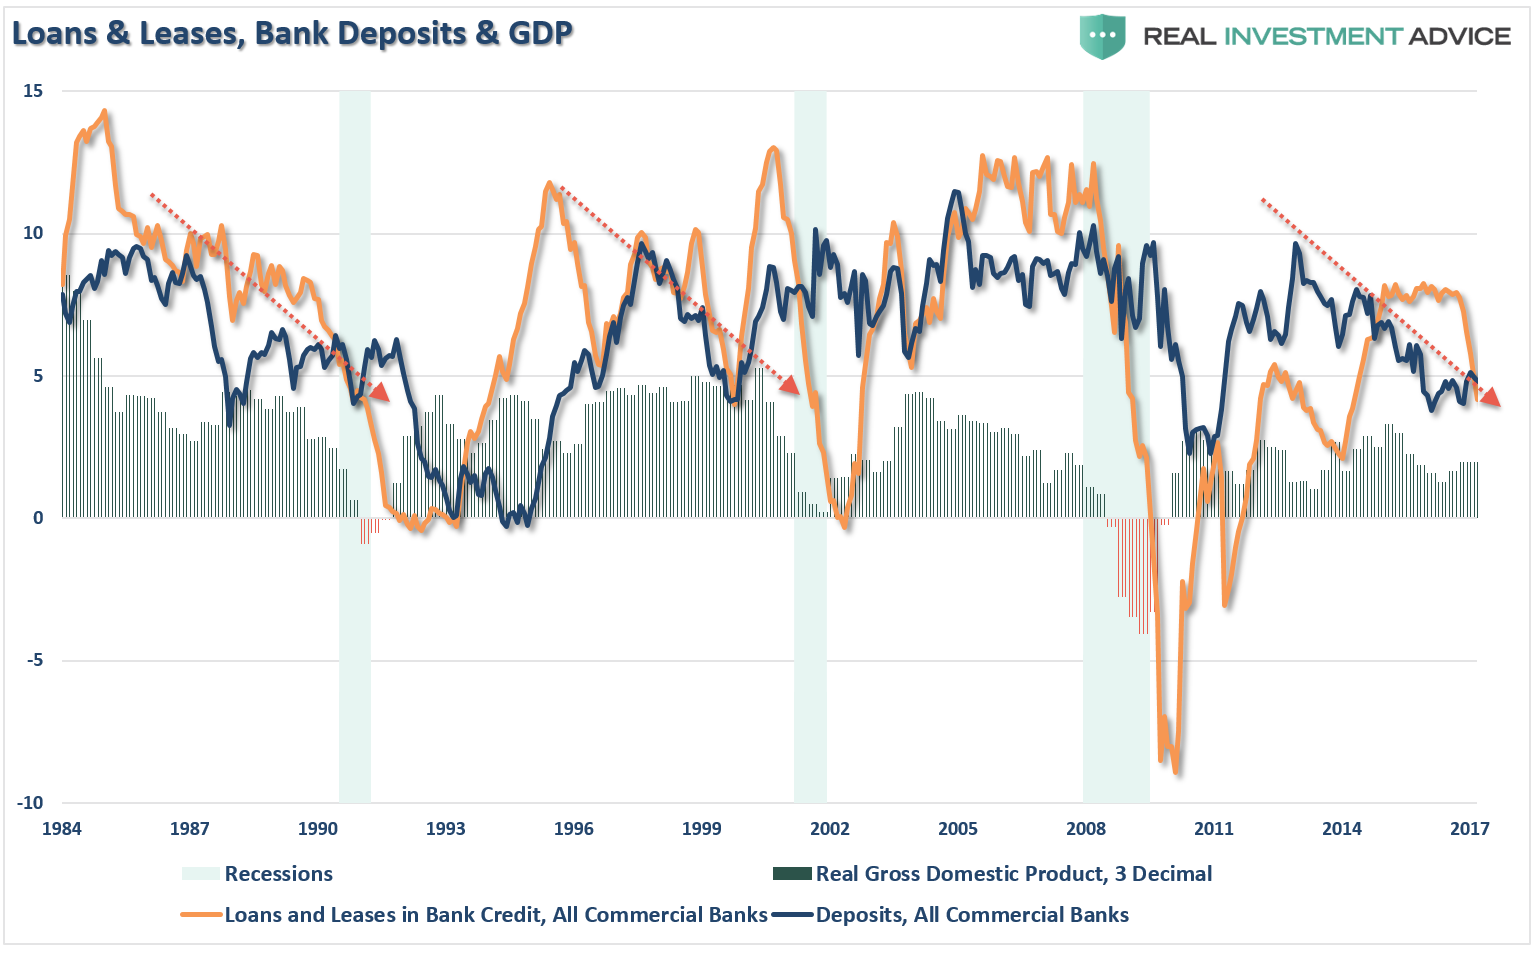
The chart below shows bank loans and leases as well as bank reserves held at the Fed. The precipitous drop is somewhat concerning. Commercial bank reserves held at the Fed have dropped by -20% from the peak of $2.79 trillion in 2014 to $2.23 trillion currently. Also, as shown, the drops in reserve balances has also corresponded to declines in 10-year rates as well. The recent drop in rates from 2.6% a month ago to 2.3% on Tuesday will likely see reserve balances decline in the next data update.
Furthermore, the year over year change in Commercial Bank loans and leases has dropped by almost half from the narrow range of 7.6% to 8.0% that prevailed from Jan. 2015 to Sept. 2016 to the current level of 3.8% currently which is at the level that preceded the past two recessions. Also, the annual change in Commercial Bank Deposits held at the Fed has dropped by more than one-half from the recent high of 10.3% in 2012 to 4.8% currently.
As my “Canadian economist” (I know, two strikes already) friend, Gerry O’Brien, pointed out:
“The deteriorating trends in Commercial Banking activity is important, especially when combined with the Fed’s indication from their recent FOMC minutes they are considering plans to begin reducing their balance sheet this year. Their ongoing march to hike rates, and now potentially reduce liquidity, suggests a rapid reduction in liquidity which will hit stocks and interest rates this year.”
Don’t dismiss the importance of that statement.
When looking at the Fed balance sheet from a long-term view it only APPEARS to have flattened compared to the massive increases that were taking place previously. Of course, given the recent spike in the market since the election, many have assumed the liquidity push by the Fed has been replaced by stronger earnings and economic growth expectations.

Not so fast.
If we zoom in we can see the reinvestment process taking place by the Fed which continues to provide support for assets prices though continued injections of liquidity into the system, albeit at a much lower pace.
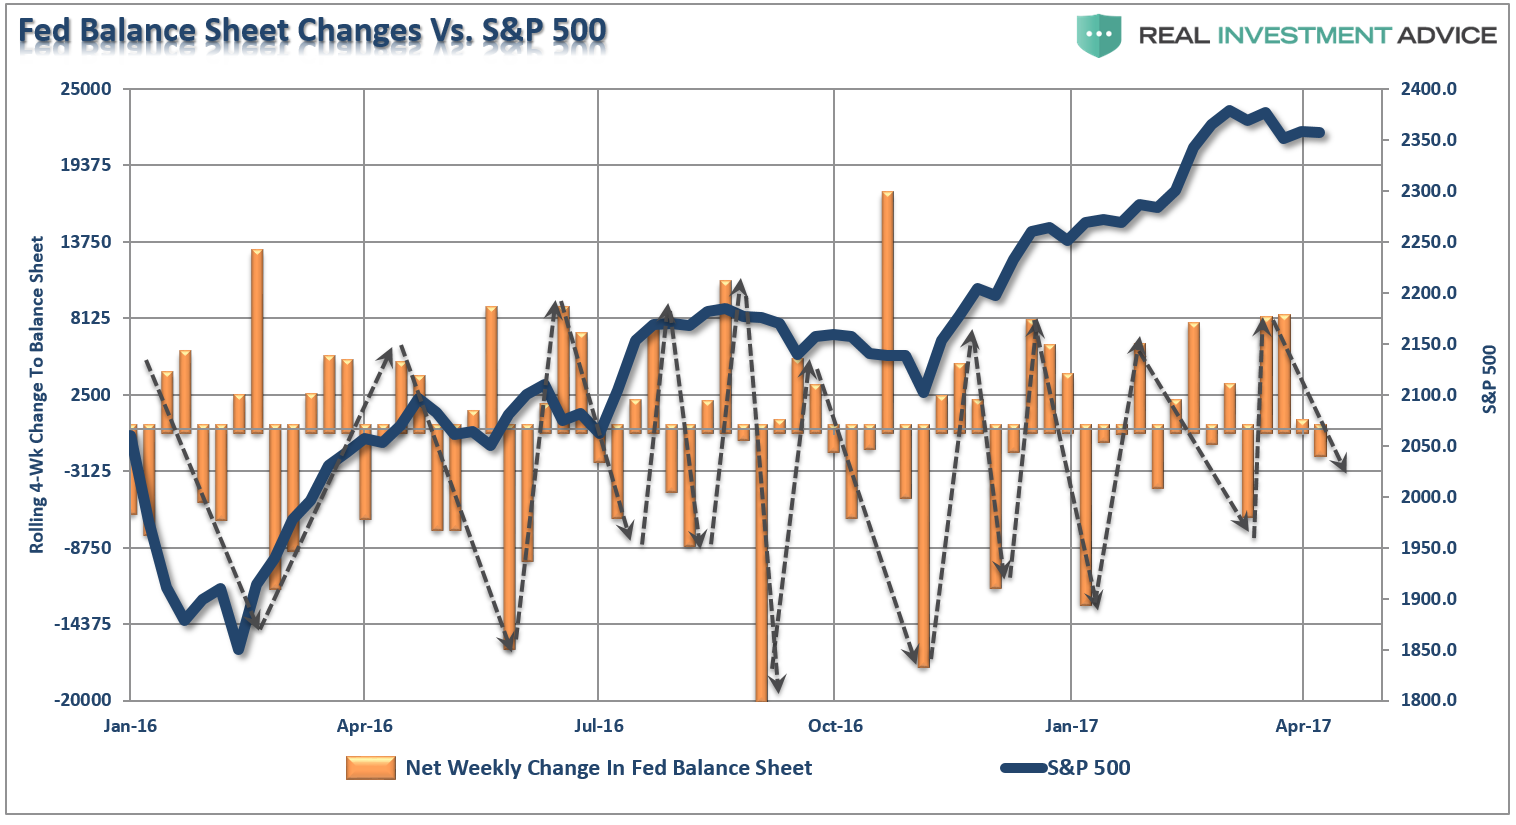
To be clear, I am not suggesting this is the ONLY catalyst to the rise in the market since the election. Clearly, the return of “exuberance” due to the “expectations” of tax cuts, repatriation, and infrastructure have led to a surge in optimism along with numerous other factors like an extremely warm winter and a restocking cycle driven by a coming increase in logistic rates. However, “expectations” have gone unfulfilled and the restocking cycle to beat a price hike has likely come to an end. This puts the Fed in a precarious position of tightening monetary policy without a fiscal policy offset.
Of course, it is not just the Fed slowing the rate of liquidity but also the Central Banks of England and China.
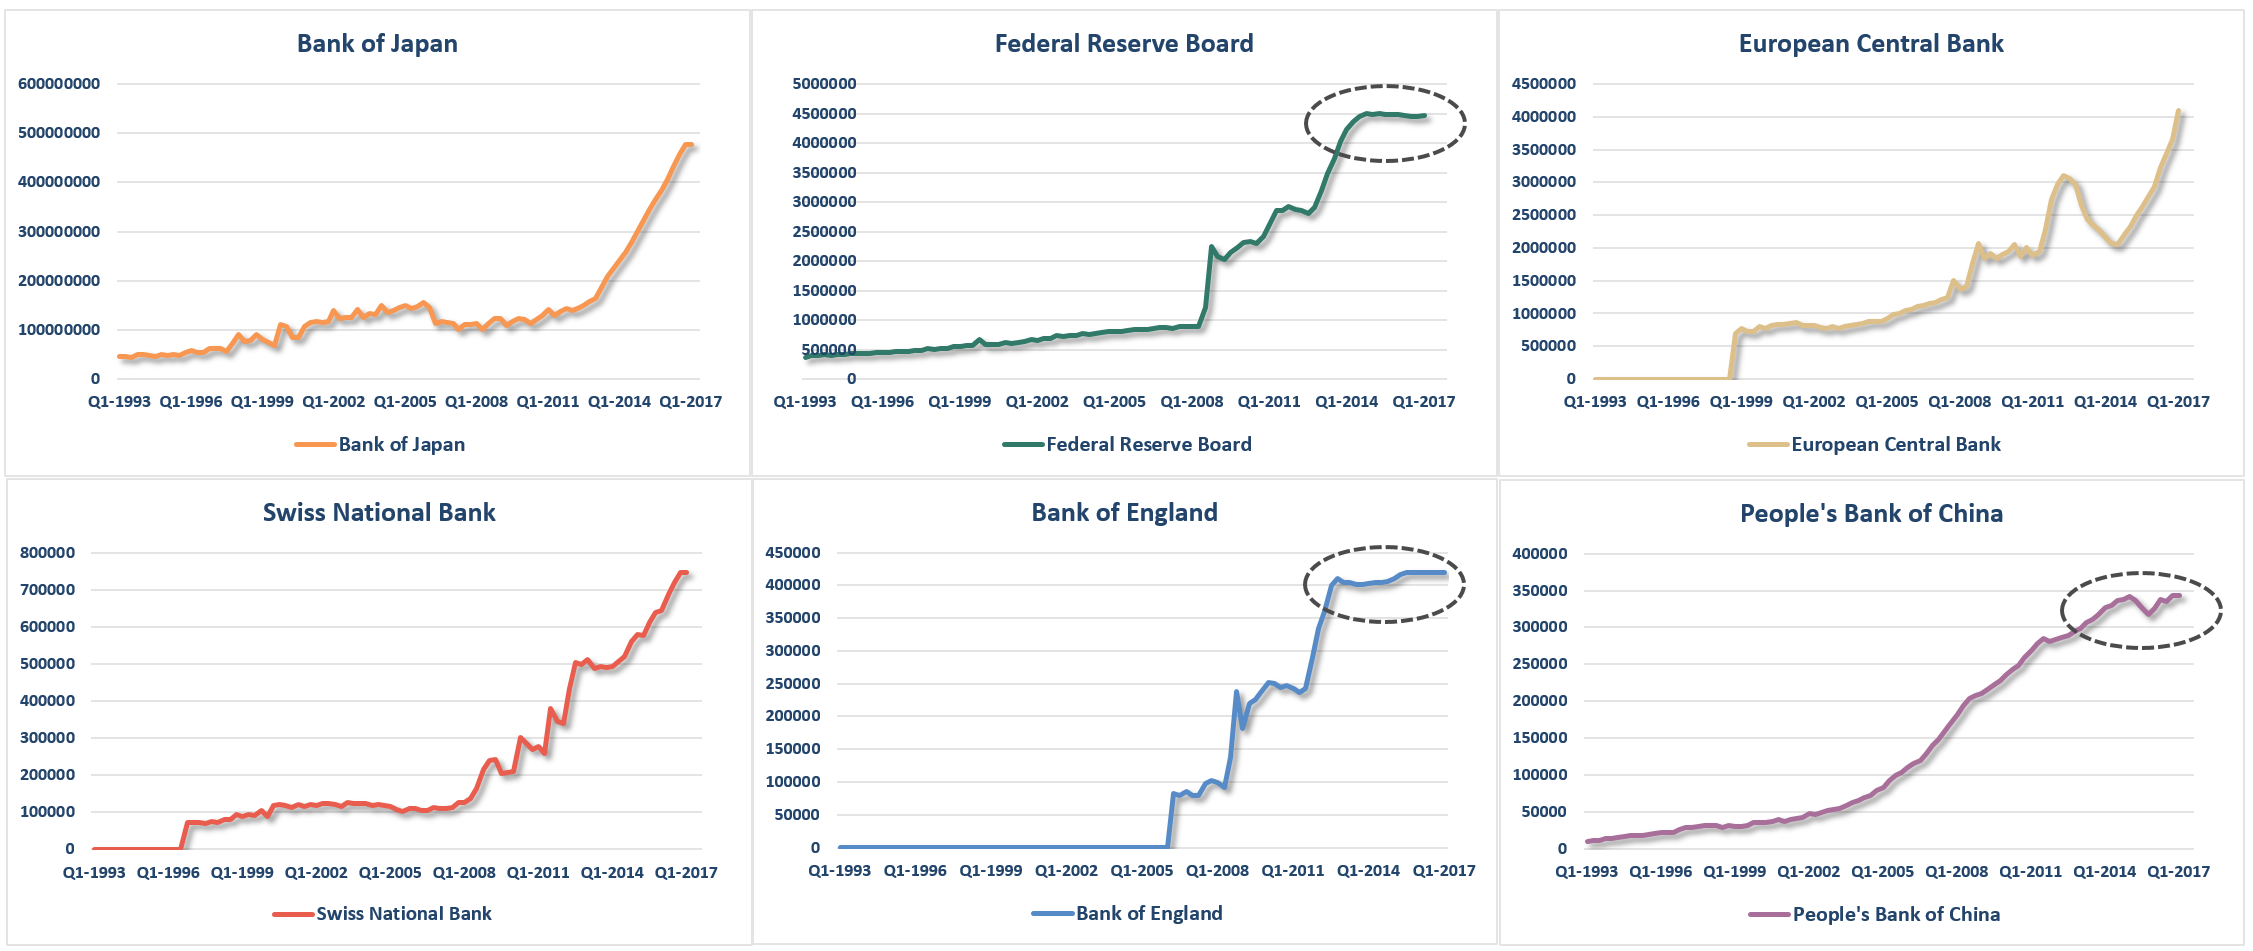
With the Bank of Japan and the European Central Bank recently hinting at they may also begin to “taper” their respective liquidity driven operations, all of this suggests the illusion of liquidity may be starting to evaporate.
Rates Below 1% As Stocks Get Hit
The illusion of liquidity has a dangerous side effect. The process of the previous two debt-deleveraging cycles led to rather sharp market reversions as margin calls, and the subsequent unwinding of margin debt fueled a liquidation cycle in financial assets. The resultant loss of the “wealth effect” weighed on consumption pushing the economy into recession which then impacted corporate and household debt leading to defaults, write-offs, and bankruptcies.
With the push lower in interest rates, the assumed “riskiness” of piling on leverage was removed. However, while the cost of sustaining higher debt levels is lower, the consequences of excess leverage in the system remains the same.
Outside of other events such as the S&L Crisis, Asian Contagion, Long-Term Capital Management, etc. which all drove money out of stocks and into bonds pushing rates lower, recessionary environments are especially prone at suppressing rates further. Given the current low level of interest rates, the next recessionary bout in the economy will very likely see rates approaching zero.

Furthermore, given rates are already near zero in many parts of the world, which will likely go negative during a global recessionary environment, near zero yields will still remain more attractive to foreign investors. This will be from both a potential capital appreciation perspective (expectations of negative rates in the U.S.) and the perceived safety and liquidity of the U.S. Treasury market.
Lastly, my recent points on current levels of volatility, and the expectation of a reversal, also support the idea of lower interest rates. As I stated:
“In my opinion, there seems to be a higher than normal probability that volatility will take a turn higher sooner rather than later. As such as I have added a net long position in portfolio betting on a rise to hedge against the coincident decline in my net long equity holdings at the current time.”
Not surprisingly, increasing rates of volatility that coincide with declines in asset prices have also coincided with declines in interest rates.
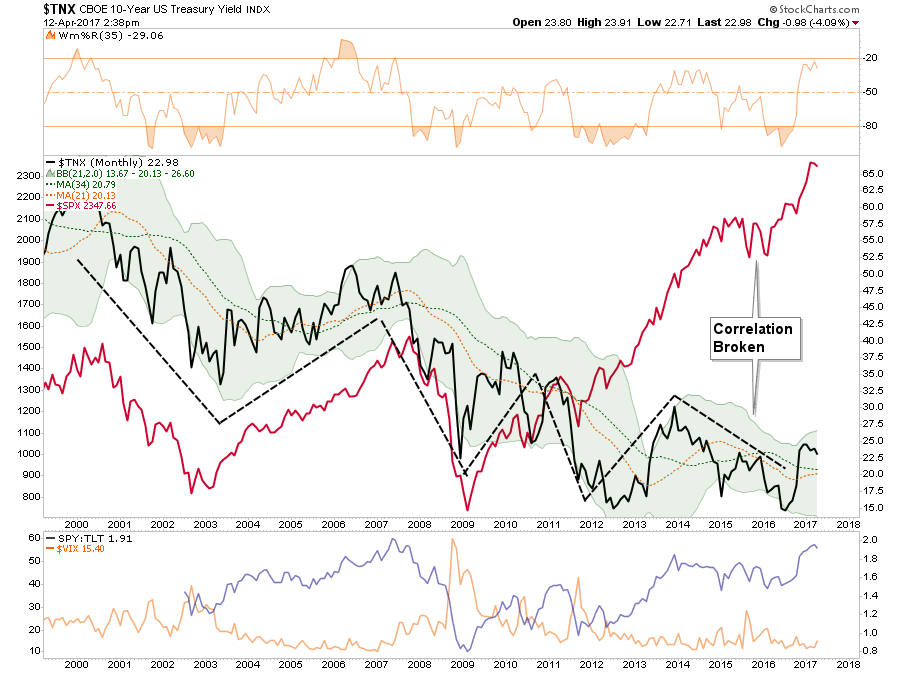
The chart below shows the historical correlation between bonds and stocks. Since the turn of the century, the “risk on/off” trade can be clearly seen. However, beginning with QE3 in 2013, that historical correlation was broken but now looks like to be returning back to historical norms. With volatility low and the stock/bond ratio at historically high levels, the reversion of those two indicators has historically led to substantially lower yields.
Here is the point, while the punditry continues to push a narrative that “stocks are the only game in town,” this will likely turn out to be poor advice. But such is the nature of a media driven analysis with a lack of historical experience or perspective.
From many perspectives, the real risk of the heavy equity exposure in portfolios is outweighed by the potential for further reward. The realization of “risk,” when it occurs, will lead to a rapid unwinding of the markets pushing volatility higher and bond yields lower. This is why I continue to acquire bonds on rallies in the markets, which suppresses bond prices, to increase portfolio income and hedge against a future market dislocation.
In other words, I get paid to hedge risk, lower portfolio volatility and protect capital. Bonds aren’t dead, in fact, they are likely going to be your best investment in the not too distant future.
In the short-term, the market could surely rise. This is a point I will not argue as investors are historically prone to chase returns until the very end. But over the intermediate to longer-term time frame, the consequences are entirely negative.
As my mom used to say:
“It’s all fun and games until someone gets their eye put out.”
Lance Roberts is a Chief Portfolio Strategist/Economist for Clarity Financial. He is also the host of “The Lance Roberts Show” and Chief Editor of the “Real Investment Advice” website and author of “Real Investment Daily” blog and “Real Investment Report“. Follow Lance on Facebook, Twitter and Linked-In
Copyright © Clarity Financial