


by Don Vialoux, Timingthemarket.ca
Economic News This Week
March New Home Sales to be released at 10:00 AM EDT on Monday are expected to increase to 521,000 units from 512,000 units in February
March Durable Goods Orders to be released at 8:30 AM EDT on Tuesday are expected to increase 1.7% versus a decline of 2.8% in February. Excluding Transportation, Orders are expected to increase 0.5% versus a decline of 1.0% in February.
February Case/Shiller 20 City Home Price Index to be released at 9:00 AM EDT on Tuesday is expected to show a year-over-year gain of 5.6% versus a 5.7% increase in January.
FOMC Rate Decision to be released at 2:00 PM EDT on Wednesday is expected to maintain the Fed Fund rate at 0.25%-0.50%.
Advanced First Quarter 2016 Real GDP to be released at 8:30 AM EDT on Thursday is expected to increase 0.9% versus a gain of 1.4% in the fourth quarter of 2015
March Personal Income to be released at 8:30 AM EDT on Friday is expected to increase 0.3% versus a gain of 0.2% in February. March Personal Spending is expected to increase 0.2% versus a decline of 0.1% in February
Cdn. February Real GDP to be released at 8:30 AM EDT on Friday is expected to slip 0.2% versus a gain of 0.6% in January.
April Chicago PMI to be released at 9:45 AM EDT on Friday is expected to slip to 53.3 from 53.6 in March.
April Michigan Sentiment Index to be released at 10:00 AM EDT on Friday is expected to increase to 90.0 from 89.7 in March.
Earnings News This Week

The Bottom Line
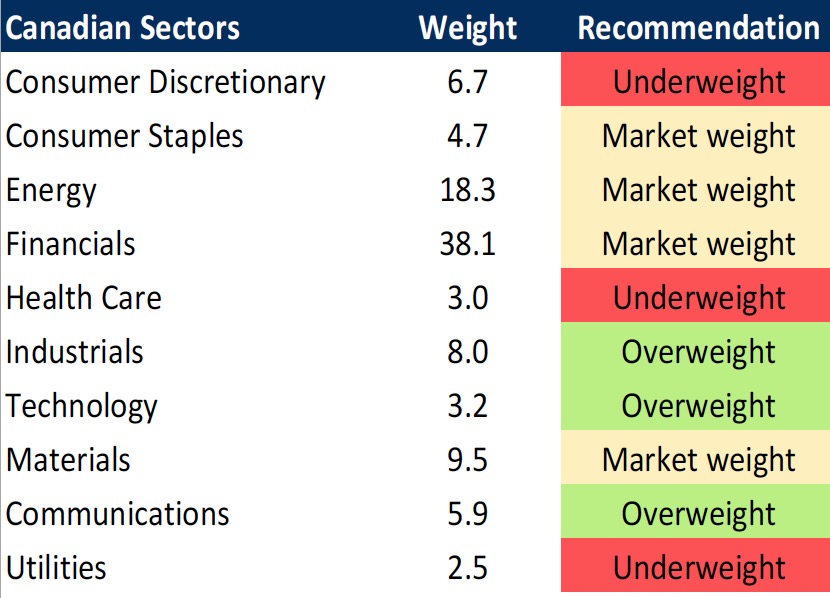
Technical signs of rotation out of previous outperforming equity markets and sectors became apparent late week (e.g. Utilities, Consumer Staples, REITs and Information Technology). The rotation occurred at a time when equity markets frequently reach a seasonal peak. Intermediate downside risk exceeds intermediate upside potential both for trading accounts and investment accounts. Appropriate action is recommended when short term overbought momentum indicators roll over.
Interesting Observations
Economic focus this week is on the FOMC meeting on Tuesday and Wednesday. Consensus is that the Federal Reserve will maintain the Fed Fund Rate at 0.25-0.50%. However, the bond market began to respond last week to anticipation of message by the Fed that it plans to increase the Fed Fund rate soon based on incremental evidence that slow U.S. economic growth is accelerating.
Technical action by individual S&P 500 stocks on the surface appeared positive last week: 69 stocks broke resistance. However, 15 stocks broke support with most of the breakdowns occurring on Thursday and Friday. Most of the breakdowns occurred in the utilities and consumer staples sectors. Technical momentum by individual equities has rolled over from overbought levels.
First quarter reports began to flood in last week. Approximately 130 companies have reported quarterly reports to date: 76% reported above consensus earnings and 55% reported above consensus revenues. Generally, U.S. equity markets rewarded stocks of companies that reported higher than consensus earnings and did not punish stocks of companies that missed consensus earnings. Earnings per share to date have dropped 8.9% year-over-year and revenues have dropped 1.2%
The flood of first quarter reports continues this week. Another 187 S&P 500 companies and 8 Dow Jones Industrial Average companies are scheduled to be released this week. According to FactSet, current consensus is that earnings per share on a year-over-year basis will fall 9.1% and revenues will slip 1.2%. Going forward, consensus for earnings per share on a year-over-year basis will be a drop of 3.8% in the second quarter, a gain of 3.2% in the third quarter and a gain of 8.4% in the fourth quarter. Consensus for revenues on a year-over-year basis is a decline of 0.8% in the second quarter, a gain of 1.9% in the third quarter and an increase of 4.4% in the fourth quarter.
Strength in U.S. Treasury yields is starting to curtail momentum in U.S. equities. A move by 10 year Treasury yields above 2.01% (currently 1.89%) likely will prompt a sharp downtrend in equity prices
Seasonal influences on selected sectors relative to the S&P 500 Index turn neutral/negative at this time of year including Consumer Discretionary, Canadian and U.S. Financials, Retail, Transportation, Base Metals, Platinum, Nikkei and Emerging Markets.
U.S. equity indices during U.S. Presidential election years tend to trend down between now and late May.

First quarter earnings and revenue prospects for TSX 60 companies are more encouraging. An average (median) year-over-year gain of 1.2% is anticipated.
Short and intermediate technical indicators for most equity markets and sectors are overbought. Some already show signs of rolling over
StockTwits Released on Friday @EquityClock
Yield plays falling out of favour as investors shed defensive bets.
Technical action by S&P 500 stocks to 10:15: Bullish. Breakouts: $HBI, $FOX, $ETFC, $BIIB, CSX, NSC, BHI. Breakdown: $AAL
Editor’s Note: After 10:15 AM EDT, Breakouts included Anthem and Westrock. Breakdowns included Kroger, Host Hotels and Perrigo.
Equity Indices and Related ETFs
The fall in technical scores on Friday was significant.
Daily Seasonal/Technical Equity Trends for April 22nd 2016
![clip_image002[5]](https://advisoranalyst.com/transfer/http://www.timingthemarket.ca/techtalk/wp-content/uploads/2016/04/clip_image0025-8.png "clip_image002[5]")
Green: Increase from previous day
Red: Decrease from previous day
Calculating Technical Scores
Technical scores are calculated as follows:
Intermediate Uptrend based on at least 20 trading days: Score 2
Higher highs and higher lows
Intermediate Neutral trend: Score 0
Not up or down
Intermediate Downtrend: Score -2
Lower highs and lower lows
Outperformance relative to the S&P 500 Index: Score: 2
Neutral Performance relative to the S&P 500 Index: 0
Underperformance relative to the S&P 500 Index: Score –2
Above 20 day moving average: Score 1
At 20 day moving average: Score: 0
Below 20 day moving average: –1
Up trending momentum indicators (Daily Stochastics, RSI and MACD): 1
Mixed momentum indicators: 0
Down trending momentum indicators: –1
Technical scores range from -6 to +6. Technical buy signals based on the above guidelines start when a security advances to at least 0.0, but preferably 2.0 or higher. Technical sell/short signals start when a security descends to 0, but preferably -2.0 or lower.
Long positions require maintaining a technical score of -2.0 or higher. Conversely, a short position requires maintaining a technical score of +2.0 or lower.
The S&P 500 Index gained 10.85 points (0.52%) last week. Intermediate trend remained up. The Index remained above its 20 day moving average. Short term momentum indicators turned mixed on Friday.

Percent of S&P 500 stocks trading above their 50 day moving average (Also known as the S&P Momentum Barometer) dropped last week to 80.20% from 89.00%. Percent has rolled over from an intermediate overbought level and has established a downtrend.

Percent of S&P 500 stocks trading above their 200 day moving average increased last week to 74.00% from 66.60%. Percent is intermediate overbought and trending higher.

Bullish Percent Index for S&P 500 Index increased last week to 78.40% from 77.40% and remained above its 20 day moving average. The Index remains intermediate overbought.

Bullish Percent Index for TSX stocks increased last week to 72.38% from 66.95% and remained above its 20 day moving average. The Index remains intermediate overbought.

The TSX Composite Index added 236.78 points (1.74%) last week. Intermediate trend remains up (Score: 2). Strength relative to the S&P 500 Index improved last week to Positive from Neutral (Score: 2). The Index remained above its 20 day moving average (Score:1). Short term momentum indicators are trending up (Score: 1). Technical score improved last week to 6 from 4.

Percent of TSX stocks trading above their 50 day moving average (Also known as the TSX Momentum Barometer) slipped last week to 79.06% from 79.40%. Percent remains intermediate overbought and showing signs of rolling over.

Percent of TSX stocks trading above their 200 day moving average increased last week to 70.09% from 63.09%. Percent remains intermediate overbought and trending higher.

The Dow Jones Industrial Average gained 105.99 points (0.59%) last week. Intermediate trend remained up. Strength relative to the S&P 500 Index remained Neutral. The Average remained above its 20 day moving average. Short term momentum indicators turned mixed on Friday. Technical score slipped last week to 3 from 4.

Bullish Percent Index for Dow Jones Industrial Average increased last week to 96.67% from 90.00% and returned to above its 20 day moving average. The Index remains intermediate overbought and remains in an uptrend.

Bullish Percent Index for NASDAQ Composite stocks increased last week to 56.04% from 54.58% and remained above its 20 day moving average. The Index remains intermediate overbought and trending higher.

The NASDAQ Composite Index slipped 31.99 points (0.65%) last week. Intermediate trend remained Neutral. Strength relative to the S&P 500 changed on Friday to Negative from Positive. Short term momentum indicators turned down on Friday. Technical score last week dropped to -2 from 4.

Russell 2000 Index added 15.77 points (1.39%) last week. Intermediate trend remained Neutral. Strength relative to the S&P 500 Index remained Positive. The Index remained above its 20 day moving average. Short term momentum indicators continue to trend higher, but are overbought and showing early signs of peaking. Technical score remained last week at 4.

The Dow Jones Transportation Average added 107.82 points (1.35%) last week. Intermediate trend changed to up from down on a move above 8,114.27. Strength relative to the S&P 500 Index remained Neutral last week. The Average remains above its 20 day moving average. Short term momentum indicators have turned Mixed. Technical score improved last week to 3 from 0.

The Australia All Ordinaries Composite Index added 75.10 points (1.44%) last week. Intermediate trend changed to Up from Neutral on a move above 5,272.10. Strength relative to the S&P 500 Index improved to Positive from Neutral. The Index remained above its 20 day moving average. Short term momentum indicators continued to trend higher. Technical score improved to 6 from 2.

The Nikkei Average jumped 724.46 points (4.30%) last week. Intermediate trend changed to up from down on a move above 17,291.35. Strength relative to the S&P 500 Index changed to Positive from Neutral. The Average remained above its 20 day moving average. Short term momentum indicators are trending up. Technical score improved last week to 6 from 0.

Europe 350 iShares gained $0.67 (1.69%) last week. Intermediate trend remained Up. Strength relative to the S&P 500 Index changed to Positive from Neutral. Units remained above their 20 day moving average. Short term momentum indicators turned Mixed on Friday. Technical score last week improved to 5 from 4.

The Shanghai Composite Index dropped 118.3.86%) last week. Intermediate trend remained Up. Strength relative to the S&P 500 Index turned to Negative from Positive last week. The Index dropped below its 20 day moving average. Short term momentum indicators are trending down. Technical score dropped last week to -2.

Emerging Markets iShares slipped $0.03 (0.09%) last week. Intermediate trend remained up. Strength relative to the S&P 500 Index changed to Neutral from Positive on Friday. Units remained above their 20 day moving average. Short term momentum indicators turned down on Friday. Technical score dropped last week to 2 from 6.

Currencies
The U.S. Dollar Index added $0.39 (0.41%) last week with more than all of the gain recorded on Friday. Intermediate trend remained down. The Index moved above its 20 day moving average on Friday. Short term momentum indicators are trending up.

The Euro dropped 0.52 (0.46%) last week. Intermediate trend remained up. The Euro remained below its 20 day moving average. Short term momentum indicators are trending down.

The Canadian Dollar gained U.S. 1.01 cents (1.30%) last week. Intermediate trend remained up. The Canuck Buck remained above its 20 day moving average. Short term momentum indicators are trending up and are overbought.

The Japanese Yen dropped 2.46 (2.68%) last week. Intermediate trend remained up. The Yen fell below its 20 day moving average on Friday. Short term momentum indicators are trending down.

Commodities
Daily Seasonal/Technical Commodities Trends for April 22nd 2016
![clip_image002[7]](https://advisoranalyst.com/transfer/http://www.timingthemarket.ca/techtalk/wp-content/uploads/2016/04/clip_image0027-1.png "clip_image002[7]")
Green: Increase from previous day
Red: Decrease from previous day
The CRB Index gained 6.01 points (3.46%) last week. Intermediate uptrend was confirmed on a move above 178.68. Strength relative to the S&P 500 Index remained Positive. The Index remained above its 20 day moving average. Short term momentum indicators are trending up. Technical score remained last week at 6.

Gasoline gained $0.07 per gallon (4.73%) last week. Intermediate trend remains up. Strength relative to the S&P 500 Index slipped to Neutral from Positive. Gas remained above its 20 day moving average. Short term momentum indicators are trending up. Technical score: 4.

Crude Oil gained $2.02 per barrel (4.84%) last week. Intermediate trend remained up. Strength relative to the S&P 500 Index remained Positive. Crude remained above its 20 day moving average. Short term momentum indicators continue to trend up. Technical score remained at 6.

Natural Gas gained $0.37 per MBtu (19.47%) last week. Intermediate trend remained up. Strength relative to the S&P 500 Index improved last week to Positive from Neutral. “Natty” moved back above its 20 day moving average. Short term momentum indicators turned up. Technical score improved last week to 6 from 0.

The S&P Energy Index gained 24.71 points (5.20%) last week. Intermediate trend remained up. Strength relative to the S&P 500 Index remained Positive. The Index remained above its 20 day moving average. Short term momentum indicators are trending up. Technical score remained last week at 6.

The Philadelphia Oil Services Index gained 16.13 points (10.04%) last week. Intermediate uptrend was re-affirmed on a move above 168.59. Strength relative to the S&P 500 Index changed last week to Positive from Neutral. The Index remained above its 20 day moving average. Short term momentum indicators are trending up. Technical score improved to 6 from 4.

Gold slipped $4.60 per ounce (0.37%) last week. Intermediate trend remained up. Strength relative to the S&P 500 Index remained Neutral. Gold returned to below its 20 day moving average on Friday. Short term momentum indicators are trending down. Technical score dropped last week to 0 from 4.

Silver gained $0.64 per ounce (3.92%) last week. Intermediate trend remained up. Strength relative to the S&P 500 Index remained Positive. Silver remained above its 20 day moving average. Short term momentum indicators are trending up, but are overbought and showing early signs of peaking. Technical score remained last week at 6. Strength relative to Gold remains Positive.

The AMEX Gold Bug Index gained 4.14 points (2.09%) last week. Intermediate trend remained up. Strength relative to the S&P 500 Index remained Positive. The Index remained above its 20 day moving average. Short term momentum indicators turned mixed. Technical score improved last week to 5 from 4.

Platinum gained $21.30 per ounce (2.15%) last week. Intermediate uptrend was re-affirmed on a move above $1,011.10. Relative strength improved to Positive. Momentum is up. Score: 6.

Palladium gained $39.95 per ounce (7.03%) last week. Uptrend was re-affirmed on a move above $608.15. Strength relative to the S&P 500 Index turned Positive. PALL remained above its 20 day moving average. Short term momentum indicators are trending up. Score: 6

Copper added $0.12 per lb. (5.58%) last week. Intermediate trend remains Neutral. Strength relative to the S&P 500 Index changed to Positive from Negative. The Index moved above its 20 day moving average. Short term momentum indicators are trending up. Technical score improved last week to 4 from -2

The TSX Metals & Mining Index jumped 65.37 points (14.43%) last week. Intermediate uptrend was re-affirmed on a move above 510.55. Strength relative to the S&P 500 Index changed to Positive from Neutral. The Index remained above its 20 day moving average. Short term momentum indicators are trending up. Technical score improved last week to 6 from 2.

Lumber added 0.90 (0.32%) last week. Intermediate trend remained up. Relative strength remained Negative. Trades below its 20 day MA. Momentum remained down.

The Grain ETN added $0.17 (0.54%) last week. Intermediate trend remained up. Strength relative to the S&P 500 Index changed to Positive from Negative. Units remained above their 20 day moving average. Short term momentum indicators turned down on Friday. Score: 4

The Agriculture ETF added $1.96 (4.18%) last week. Intermediate uptrend was re-affirmed on a move above $47.54. Strength relative to the S&P 500 Index turned Positive from Negative. Units remained above their 20 day moving average. Short term momentum indicators are trending up. Technical score improved last week to 6 from 2.

Interest Rates
The yield on 10 year Treasuries increased 13.6 basis points (7.76%) last week. Intermediate trend remained down. Yield moved above its 20 day moving average. Short term momentum indicators are trending up.

Conversely, price of the long term Treasury ETF dropped $3.52 (2.67%) last week. Intermediate trend remained up. Price dropped below its 20 day moving average. Short term momentum indicators are trending down.

Volatility
The VIX Index dropped another 0.40 (2.94%) last week. Intermediate trend remains down. The Index remains below its 20 day moving average.

Sectors
Daily Seasonal/Technical Sector Trends for March April 22nd 2016
![clip_image002[9]](https://advisoranalyst.com/transfer/http://www.timingthemarket.ca/techtalk/wp-content/uploads/2016/04/clip_image0029-2.png "clip_image002[9]")
Green: Increase from previous day
Red: Decrease from previous day
Special Free Services available through www.equityclock.com
Equityclock.com is offering free access to a data base showing seasonal studies on individual stocks and sectors. The data base holds seasonality studies on over 1000 big and moderate cap securities and indices. To login, simply go to http://www.equityclock.com/charts/ Following is an example:

Mark Leibovit’s Wall Street Raw Radio Broadcast
MARK LEIBOVIT – WALL STREET RAW RADIO 4/23/16 WITH SINCLAIR NOE AND ERIC HADIK
Accountability Report
Visa (V $79.11) was supported with price and seasonality charts on March 29th when price of the stock was $75.19. On Friday, short term technical parameters turned negative: The stock fell below its 20 day moving average, strength relative to the S&P 500 Index turned negative and short term momentum indicators began to trend down. The stock no longer is supported.
Disclaimer: Seasonality and technical ratings offered in this report by www.timingthemarket.ca and www.equityclock.com are for information only. They should not be considered as advice to purchase or to sell mentioned securities. Data offered in this report is believed to be accurate, but is not guaranteed
Copyright © DV Tech Talk, Timingthemarket.ca