


SIA Weekly: What's behind the Continued Weakness in CADUSD?
For this week's SIA Equity Leaders Weekly we are going to look at the CADUSD currency as the continued decline of the Canadian dollar is being affected by many aspects, especially the interest rate policy of the two countries and declining crude oil prices.
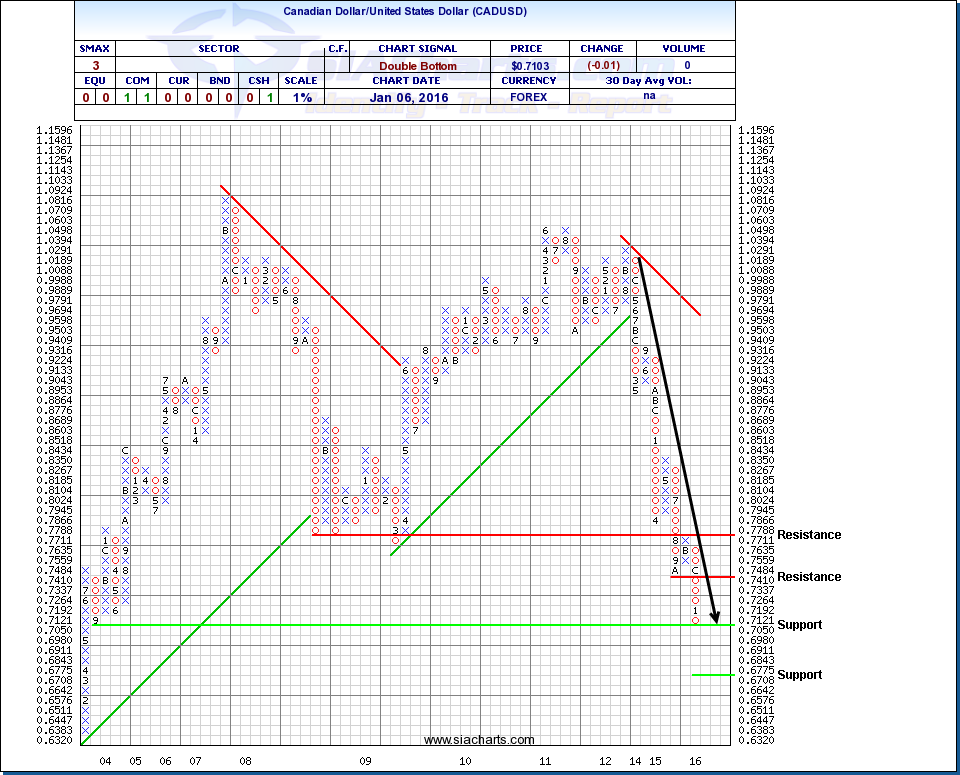
Canadian Dollar/United States Dollar (CADUSD)
We have mostly focused on the USDCAD chart in our currency analysis, but wanted to chart the CADUSD chart to better visualize the fall the CAD dollar has taken over the past few years easier. The Canadian dollar ended the day at its lowest point in more than 12 years threatening to fall below 70 cents. The historical low of 61.79 cents USD set back in January of 2002 was almost unthinkable to mention just 2 years ago when the Canadian dollar was trading around 95 cents USD. SIA has followed the drop in Crude Oil over the last few years closely commenting every month on the relative weakness seen in this commodity and this has had great impact on the Canadian dollar as the oil-sensitive currency has continued its free-fall down to the support level found at 0.7050. Below this, support could be found at 0.6708 and then again at its all-time low if it continues its decline.
Going forward in 2016, the central banks on either side of the border may dictate or have the most influence on direction based on respective interest rate policy. With interest rates potentially rising in the US and potentially lowering in Canada, and crude oil prices continuing to plummet, the loonie still has risk to fall even further. As stated previously with the continued strength in the US dollar, we have seen the continued weakness in most commodity influenced economies
Click on Image to Enlarge
Gold Continuous Contract (GC.F)
Crude Oil prices plunged ~6% today below $35 per barrel for the first time since 2004 on fears of continued global surplus and commodities overall continue their slide. Gold was up 1% on the day, but am struggling to find much glimmer on the long-term trajectory when looking at the point and figure chart that has seen gold slowly decline to the support level at 1045.81 over the past 4 years. Further support can be found around the $1000 area at $985.49 if the weakness continues.
Gold, like many commodities, many have increased volatility during periods of global and geopolitical instability with fluctuating markets. Gold is often thought as a safe haven during these times, but has traded more in line with the relative weakness of the commodities class down ~11.5% over the last year and ~13.2% annualized over the last 3 years. In the relative strength matrices on SIACharts.com, you may see certain gold stocks jump up and down the rankings with increased volatility as investors overact to small changes in the gold price, so please consider the time frame for your investments and the long-term outlook of the underlying commodity when making investment decisions. A helpful hint for many advisors on this issue is to look at the historical ‘SIA R/S Matrix Position Chart’ by clicking the # rank on a report and click on the Max time frame to see the time this investment normally spends in the Favored zone to help you with an expected time frame for your potential trade. Please contact us for help on this issue as eliminating volatile stocks, sectors, or asset classes in your strategy can help decrease the amount of trades you are doing and lead to potential outperformance as well.
Click on Image to Enlarge
SIACharts.com specifically represents that it does not give investment advice or advocate the purchase or sale of any security or investment. None of the information contained in this website or document constitutes an offer to sell or the solicitation of an offer to buy any security or other investment or an offer to provide investment services of any kind. Neither SIACharts.com (FundCharts Inc.) nor its third party content providers shall be liable for any errors, inaccuracies or delays in content, or for any actions taken in reliance thereon.
For a more in-depth analysis on the relative strength of the equity markets, bonds, commodities, currencies, etc. or for more information on SIACharts.com, you can contact our customer support at 1-877-668-1332 or siateam@siacharts.com.