Why this is not the start of a bear market
by Cam Hui, Humble Student of the Markets
I have received a fair amount of feedback, mostly from technicians and chartists, on my view that the idea that downside risk on stock prices is limited and this is not the beginning of a major bear market. I want to clarify my views on that topic.
I base my market analysis on different dimensions of analysis, which are summarized as follows:
- Technical analysis: The stock market has suffered much technical damage, which can be resolved with another leg down, or a sideways consolidation. Trend following models, as well as other projections, suggest considerable downside risk. Call the technical outlook neutral to bearish, with a tilt towards the bearish view.
- Sentiment analysis: Many sentiment models are showing off-the-charts levels of fear. It isn't any single measure of sentiment, but most sentiment measures an across the board basis. If there is so much fear, who is left to sell? Sentiment models are therefore very bullish.
- Macro analysis: Here, the outlook is mixed. The US economy is growing so well that the Fed is contemplating raising interest rates. There is no sign of a recession on the horizon, which is a bull market killer. However, there are concerns that the slowdown in China is leaking into other EM economies, which would pull down global growth. As we are mainly focused on the effects on US equities and the US economy remains robust, I would call this neutral to a mild positive.
- Fundamental momentum: One of the key driver of US equity valuation is earnings growth. Despite much angst over Q3 earnings, forward EPS are still rising, which is still supportive of stock prices. Looking into 2016, however, I do have some concerns about the pace of EPS growth, which could put a ceiling on stock prices. Call this a short-term positive, but medium term neutral to negative.
The charts look terrible
Even Josh Brown is giving a nod to technical analysis during the current period of market turmoil:
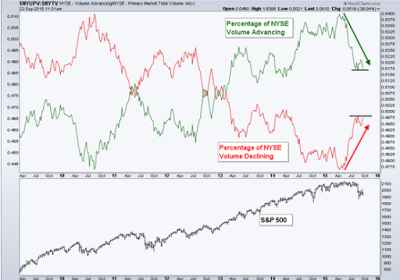
So what can you go by to figure out the mood and psychology around a stock or a market? There’s only one thing: Price itself. And the numerous derivations of price – momentum, relative strength, volume, advancing vs declining issues, moving averages, historical levels of significance.
What you are seeing in price is market psychology writ large. The emotions and attitudes surrounding a given investment are being splattered before you on a canvas. All of the fundamental data that you and others could possibly be aware of is being reflected in the lines on the chart, all day every day.
When you look at these items, they don’t scream out a binary yes-or-no, buy-or-sell answer at you. But they tell you everything you need to know about how people feel. They give you clues to arrive at where the P in PE is headed. Some clues are more valid than others at different times and all clues can fool you. Something that was significant on Tuesday can be an utter red herring on Thursday.
These are just a few of the examples that came across my desk. I could go on, but you get the idea. Technically, the risk-reward of owning stocks right now is very unfavorable.
Sentiment is contrarian bullish
I have demonstrated before (see A test for the bears) that sentiment models are showing a crowded short among several different groups of investors, namely retail (Rydex), US RIAs (NAAIM) and global institutions (BoAML Fund Manager Survey). With respect to sentiment models, I prefer metrics that reflect what people are actually doing with their money, instead of opinion surveys. That's why I give extra weight to measures like Rydex cash flows.

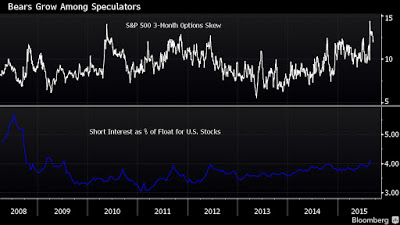
This chart (via Bloomberg) shows that option skew, or the cost of put option downside insurance compared to call option pricing, is elevated (top panel). In addition, short interest has been rising steadily (bottom panel). These are all signs of a contrarian bullish environment.
On the other hand, Barron's shows that "smart money" corporate insiders have been buying heavily since mid-August:

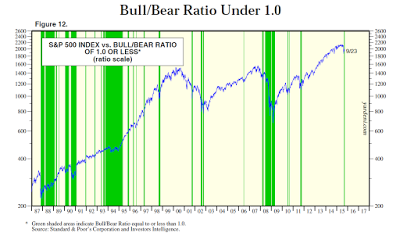
To be sure, sentiment models don't work all the time and they are weak at pinpointing the exact date of a market bottom. I received a thoughtful email from an experienced trader, who highlighted this chart from Ed Yardeni. The green bars show periods when the II bull/bear ratio was under 1.0 (crowded short). To paraphrase Keynes, sentiment can get excessively fearful than the pain threshold of your portfolio.
No indicator works all the time. That's why I rely different dimensions of market analysis.
A benign macro outlook
There are three ways that a bear market can begin:
- Recession: There is no sign of a US recession on the horizon.
- Overly aggressive Fed tightening: You've got to be kidding me! Contrast the current Fed with 1987, when the Fed tightened twice in September to defend the Dollar.
- War or revolution leading to a permanent loss of capital: How are those Confederate bonds doing, or those Tsarist Russia railway bonds?
The last two causes are not an issue right now. So let me focus on the risks of a recession. Scott Grannis sees no signs of a recession from the credit markets. Here is his take:
Today, money is abundant and resources are abundant. Even energy is abundant, because its price has fallen by over 50% in the past year or so. Corporate profits are near record highs, the supply of labor is virtually unconstrained, energy is suddenly cheap, and productive capacity is relatively abundant. This adds up to a lot of room for maneuver and very little reason for the economic engine of growth to shut down.
New Deal democrat came to a similar, but more nuanced conclusion. He maintains a weekly watch on the high frequency economic indicators and he divides them into long leading, short leading and coincidental indicators. Here are his latest comments from last week:
This week like last week highlighted the difference between those portions of the US economy most exposed to global forces, which have all turned negative, and those most insulated from global problems, which are all positive, and even strengthening. I suspect that the globe, as a whole, is in recession. With good numbers in housing and vehicle sales, and especially with gas prices declining again, the US is still positive, and although I believe we are past the midpoint of this expansion, I still remain positive through the first half of next year.
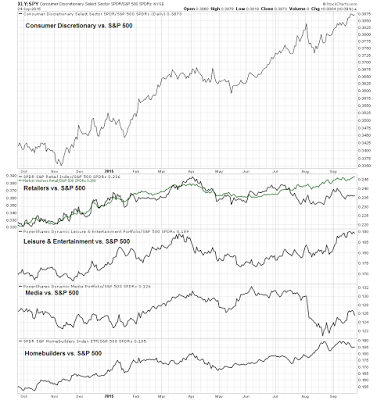
The American economy and consumer remains strong. Here is the relative returns of the Consumer Discretionary sector and some of its components relative to the SPX. With the exception of Media, which is underperforming, does this look like the market is worried about the consumer?
The main source of market angst is the slowdown coming from China and its effects on global growth. There are signs that those concerns may be overstated (via Bloomberg):
China’s economy isn’t as weak as it may look, according to a private survey from a New York-based research group that says it’s a myth the nation’s slowdown is intensifying.
“No collapse is nigh” in the aftermath of the stock market plunge and currency devaluation, according to the third-quarter China Beige Book, published by CBB International and modeled on the survey compiled by the Federal Reserve on the U.S. economy. Capital expenditure rebounded slightly in the period and the services sector showed strength, the report said.
“Perceptions of China may be more thoroughly divorced from facts on the ground than at any time in our nearly five years of surveying the economy,” CBB President Leland Miller wrote in the report. “Global sentiment on China has veered sharply bearish--too bearish. While we have long cautioned clients against relying on rosy official views of the Chinese economy, we believe sentiment has swung substantially too far in the opposite direction.”
The report describes a mixed, rather than disastrous, picture of the world’s second-largest economy. Weakening exports, deepening factory-gate deflation and a manufacturing slowdown have highlighted the risk of this year’s expansion undershooting Premier Li Keqiang’s target for growth of about 7 percent.
There are signs that all of the stimulus is paying off as the Chinese economy is starting to see a cyclical upturn. The South China Morning Post reported that the property market and land sales in first and second tier Chinese cities are perking up.
Developers have begun to beef up their land banks as China's residential property market shows signs of steady recovery.
Most of these land purchases are occurring in first- and second-tier cites but the resultant rise in land prices could squeeze some smaller players out of the market, say analysts.
"Land transactions, especially in the first-tier cities, have become very active," said David Ji, head of research and consultancy, Greater China, at international property consultant Knight Frank. "As property prices and transaction volumes rebound, developers have started bidding aggressively to replenish their land banks," he said.
If the US economy remains robust and China is turning up again, what are you so worried about?
EPS expectations holding up (for now)
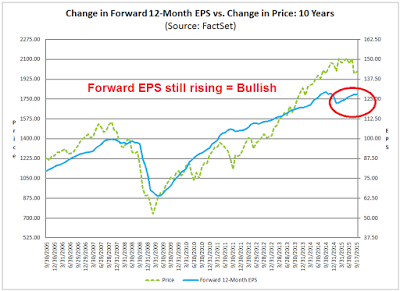
The fourth major component that I use to analyze the stock market outlook is how EPS expectations are behaving (see my previous post The right and wrong way to analyze earnings for my analytical framework). Right now, forward 12 month EPS are still growing (via Factset, annotations in red are mine).
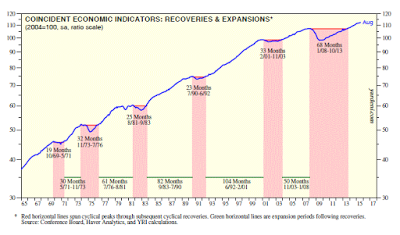
Ed Yardeni found that forward EPS is highly correlated with coincidental economic indicator and went on to guesstimate that the next recession would start in 2019
SP 500 forward earnings is highly correlated with the US index of coincident economic indicators (CEI). The latter rose to another new record high during August. Previously, I have observed that based on the past five cycles in the CEI, the next recession should start during March 2019. That’s not based on science, but rather on a simple average of the length of the previous expansions once the CEI had rebounded back to its previous cyclical peak. So it’s a benchmark of what could happen based on what happened in the past on average.
In any event, I’ve circled March 2019 as the possible date for the next recession. Given the Fed’s latest decision to do nothing, it’s safe to bet that the next recession won’t be caused by the tightening of monetary policy anytime soon. It could be caused by a severe downturn abroad, I suppose. More likely is that the US will continue to grow fast enough to keep the global economy growing as well, albeit at a pace that is best described as “secular stagnation.”
2015 = 1998 and 2011 (with a difference)
When I put it all together, my conclusion is that the template for the current corrective episode are 1998 and 2011. In both those cases, the US markets were spooked by the fear of contagion from abroad (Russia and Asia in 1998 and Europe in 2011), but the US was largely insulated from negative economic effects and life went on.
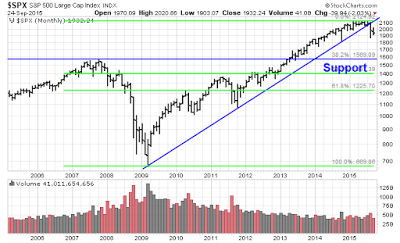
Using those episodes as rough roadmaps, the US equity market is likely to stay choppy for the next few weeks until the source of the market angst resolve themselves. It does mean that SPX downside projections of 1570 or lower are overblown. It does not mean, however, that the market will not decline and test the August lows or even the October 2014 lows at about 1820. In all likelihood, I believe we will see another minor leg down to test support in the 1820-1870 zone.
There is a key difference between 2015 and 1988 and 2011. Both of those previous corrective episodes saw the resumption of a bull trend in stock prices. This time, I have my concerns.
Given the excess fear in the markets, stocks are likely to see a reflex rally and a 2100 year-end SPX target is not unreasonable, but I have my doubts as to how much further it can go for fundamental reasons.
There is no question that the Federal Reserve is poised to raise interest rates, the only question is when, not if. When rates rise, it will start to compress the P/E ratio (because the inverse E/P is dependent on interest rates). That will put tremendous pressure on the E in that ratio to expand, which may be doubtful.
The economic cycle is maturing and the signs of a tightening labor market are everywhere. The key question as we look forward into 2016. How much can earnings grow in the face of margin pressure from rising labor costs? Jim Paulsen of Wells Capital Management recently voiced these worries, though he phrased his concerns in the context of an aging profit cycle (emphasis added):
Earnings performance is well past its best for this recovery and investors need to consider whether earnings growth will prove sufficient to support current stock market valuations. The rapidly aging earnings cycle is perhaps best illustrated by an economy nearing full employment with corporate profit margins near record highs. Should global growth remain tepid and overall sales results modest, since profit margins are unlikely to rise much, earnings trends will also likely prove disappointing. Conversely, should global growth and corporate sales results accelerate, because the U.S. is nearing full employment, companies may soon face cost-push pressures and margin erosion which will likely off set improved sales results.
Essentially, it is difficult to see how earnings growth will be adequate during the rest of this mature recovery to support current price/earnings multiples. Is a relatively modest earnings growth against a backdrop of rising inflation and higher interest rates sufficient to support the current 18 to 19 times price/earnings multiple?
Indeed, the latest speech from Janet Yellen today indicated that the economy is nearing full employment (emphasis added):
Although other indicators suggest that the unemployment rate currently understates how much slack remains in the labor market, on balance the economy is no longer far away from full employment.
In that case, wage pressures will surely start to pressure operating margins.
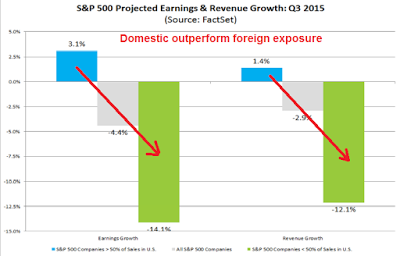
Margins could unexpectedly improve should the USD weaken. Factset did show that there is a distinct difference in Q3 earnings and revenue growth for companies exposed to the domestic economy compared to foreign sourced sales (annotations in red are mine).
In conclusion, my base case scenario calls for the market to bounce around for the next few weeks, with a rally into year-end and January. Looking out into 2016, labor costs and the USD will be key drivers of SPX profit expectations - and stock prices. In the absence of a retreat in the USD, the SPX will likely become range-bound in 2016 with 2100-2200 as a ceiling and 1900-2000 as a floor, which would fit well with a resolution of the technical damage done through a period of basing and sideways consolidation.
One last word addressed to my bearish doubters. Before you start flaming me, just a reminder that this post is in effect a mirror image of what I wrote in May: Why I am bearish (and what would change my mind).
Copyright © Cam Hui, Humble Student of the Markets