Why a recession is very unlikely
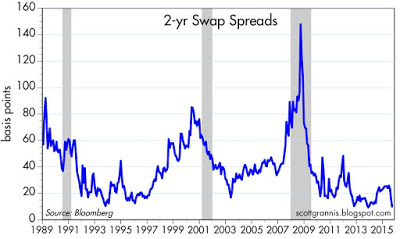
As the chart above shows, the past three recessions have been preceded by a significant rise in 2-yr swap spreads. Swap spreads, as I explain here, are essentially barometers of systemic risk. When they are as low as they are today—which is quite low, in fact—they tell us that financial markets are extremely liquid and it is very easy for those who are nervous to lay off risk on others. It's almost the opposite of the "don't shout fire in a crowded theater" phenomenon, because those who these days are worried and want to get out have almost no problem doing so. The problems happen when everyone wants to get out at once, which is what leads to high swap spreads. If everyone is feeling scared, if everyone is worried about the ability of others to survive, if money is scarce, then the underlying fundamentals have deteriorated significantly and there is something very wrong out there. Today, swap spreads are telling us that the economic and financial fundamentals are very sound; thus there is a very low probability of a recession.
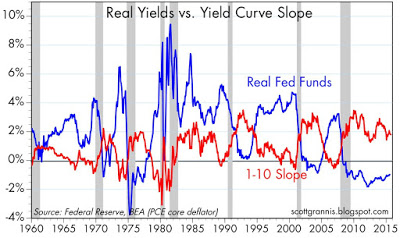
As the chart above shows, the past 8 recessions have been preceded by two very important developments in the bond market: high and rising real short-term interest rates (red line) and flat to negatively-sloped yield curves (blue line). High real short-term interest rates are the Fed's main tool for slowing down an "overheated" economy and reducing inflation. High real rates make borrowing expensive and increase the demand for money (remember: inflation happens when the supply of money exceeds the demand for money—taking steps to increase the demand for money thus reduces inflation pressures). When the Treasury yield curve becomes flat or inverted (i.e., when short-term interest rates approach and/or exceed long-term interest rates) this is the bond market's way of saying that monetary policy is so tight that it is unlikely to remain so for much longer. When long-term interest rates are higher than short-term rates, the bond market is effectively forecasting that short-term rates will be declining in the future because the Fed will sooner or later need to "help" the economy by reducing rates. A positively-sloped yield curve, on the other hand, is the bond market's way of saying that short-term interest rates are unlikely to remain low and are very likely to rise in the future because the Fed will at some point need to "withdraw the punch bowl."
In short, high real interest rates and a flat or inverted yield curve are very reliable indicators that monetary policy is so tight that it is threatening the health of the economy. That is manifestly NOT the case today. It would likely take years for these two indicators to move into the red zone.
It's common knowledge—or at least it should be—that the Fed manages monetary policy by targeting the overnight Fed funds rate. Actually, that's not exactly the case these days, because the most important tool the Fed now has is the interest rate it pays on excess reserves (IOER). But in practice they both mean the same thing: the Fed can cause short-term rates to rise or fall at will. However—and this is not so common knowledge—what the Fed is really trying to do by raising or lowering short-term interest rates is to change the level of inflation-adjusted short-term rates. If inflation is 10% and short-term rates are 5%, the monetary policy is extremely loose; but if inflation is 2% and short-term rates are 6%, then policy is extremely tight.
While the Fed can influence short-term rates directly, it has much less control over longer-term interest rates, which are set by the bond market depending on the market's expectations for inflation and real economic growth.
So the best way to understand Fed policy is to realize that the Fed controls the front end of the real yield curve, but not the back end. When the real yield curve is positively-sloped, the Fed is easy because the market figures that they will almost certainly have to raise real rates in the future. When it is flat or negatively-sloped the Fed is tight, because the market senses that the Fed will almost certainly have to lower rates in the future.
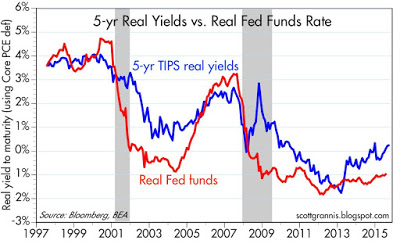
The chart above shows us two points on the real yield curve: the real Fed funds (overnight) rate and the real rate on 5-yr TIPS. Note that the red line exceeded the blue line before each of the past two recessions—which means that the real yield curve was negatively sloped prior to each recession. This chart thus reinforces the message of the preceding chart, since both the real and nominal yield curves prior to the past two recessions were negatively sloped. Today that is manifestly not the case. Real short-term rates are lower than real intermediate-term rates. The market, in other words, fully expects the Fed to increase rates going forward. Higher interest rates are a given, not something to worry about.
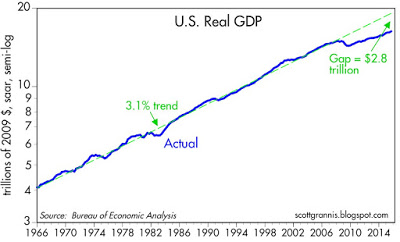
The chart above shows the level of real GDP on a semi-log scale, so that a constant slope is equal to a constant rate of growth (in this case 3.1% per year). The current recovery is unique in modern history, because the economy has for six years failed to recover to its prior trend growth rate. There is, in other words, a huge "output gap" which I estimate to be about 15%, or roughly $2.8 trillion per year in income that has gone missing. It's the weakest recovery ever.
What this means is that there is an enormous supply of unused capacity in the economy today. Maybe 5 or possibly as much as 10 million people who could be working but for whatever reason are not. Factories that have lots of idle capacity. Stores and shopping centers that have unused space. It's easier for the economy to slow down when there are lots of capacity constraints, than when—as is the case today—there is plenty of capacity. Capacity constraints tend to be associated with expensive prices for capacity, and when the Fed makes money scarce then it becomes harder for businesses to pay for labor, materials, and infrastructure. Capacity constraints plus tight money equal recession risk.
Today, money is abundant and resources are abundant. Even energy is abundant, because its price has fallen by over 50% in the past year or so. Corporate profits are near record highs, the supply of labor is virtually unconstrained, energy is suddenly cheap, and productive capacity is relatively abundant. This adds up to a lot of room for maneuver and very little reason for the economic engine of growth to shut down.
Copyright © Calafia Beach Pundit