
Agribusiness is My Favorite Base in the World
by J.C. Parets, AllStarCharts.com
The bigger the base, the higher in space. That’s the old saying that I learned from my technical predecessors years ago. I was on the phone with legend Louise Yamada earlier this week and I asked her who came up with that phrase. She told me she wasn’t sure but 35 years ago she used to hear Ralph Acampora and Alan Shaw say it all the time. Regardless, remembering this simple phrase has helped me tremendously allocating assets for our investors.
Today I want to bring up a sector that I think could be about to explode higher, simply because of its prolonged base. We’re looking at the Agribusiness sector, and more specifically the Market Vectors Global Agribusiness Index. Its components have to generate at least 50% of their revenues
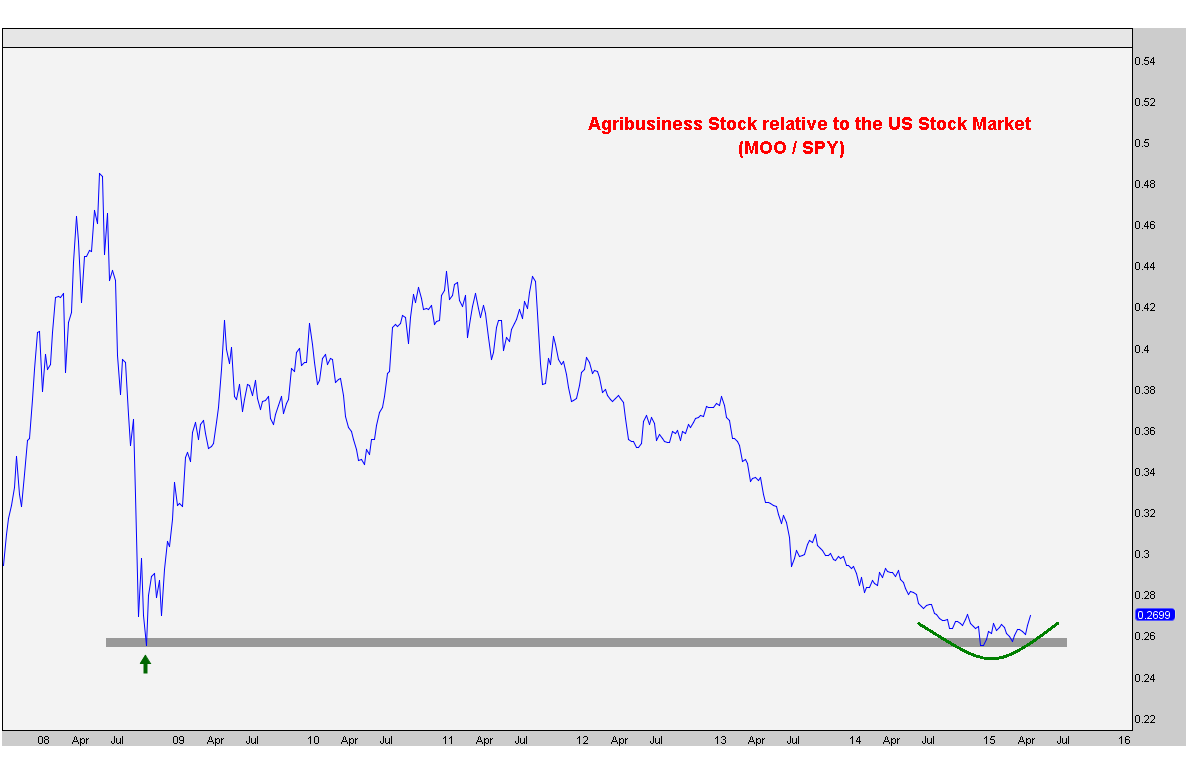
First, here is a chart showing the Agribusiness sector compared with the S&P500. Notice how we have come all the way down to where this sector really started to outperform towards the end of 2008. We are putting in a rounding bottom right at that level:
Next here is a weekly candlestick chart showing the size of this monster base going back to the highs in early 2011. Notice the higher lows along the way. This signals to us that over the last 4years the buyers are getting less and less patient and willing to pay higher prices on any dips:
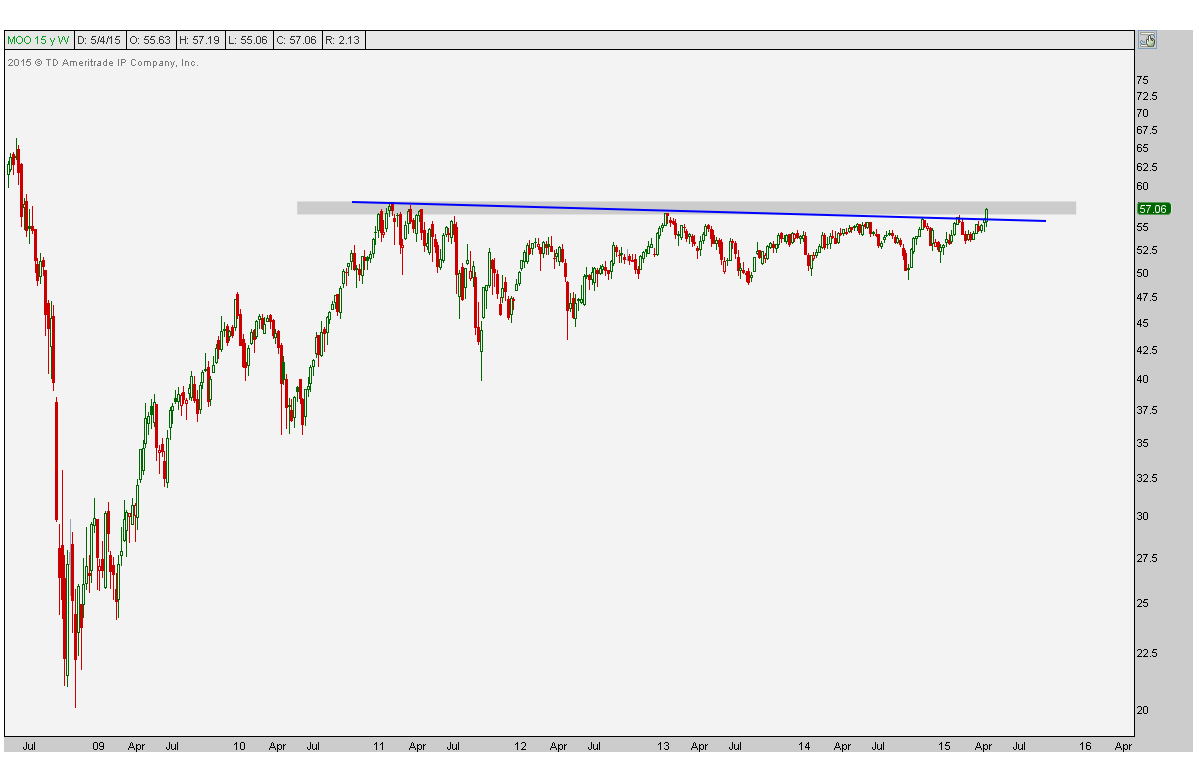
We are currently taking out a downtrend line from those 2011 highs which is our cue to really start paying attention. The overhead supply here going back 4 years is clear and defined by the gray shaded area.
From a more tactical perspective I think this week’s breakout in $MOO is a powerful one. You can see in this daily chart that we had a couple of false starts since November, but this breakaway gap cannot be ignored:
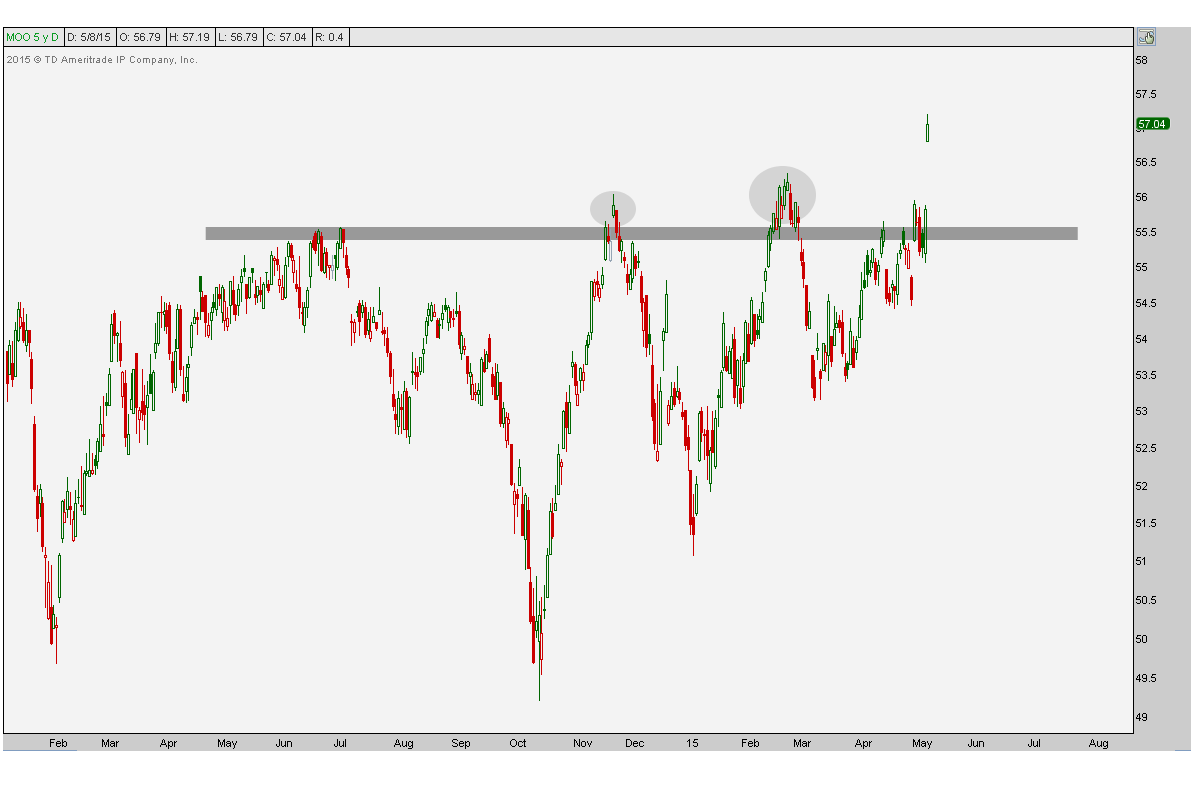
I think we’re off to the races and any dips need to be bought. From a risk management standpoint, this is only something we want to be in as long as prices are above this former overhead supply since last summer. From a structural standpoint, we can use the long downtrend line from the 2011 highs as pointed out on the weekly chart for longer-term investors.
I came into 2015 thinking this would be our first huge positions of the year, but we’ve remained patient for several reason but it’s now time to focus in on the agribusiness sector, both on absolute terms and relative to the overall market.
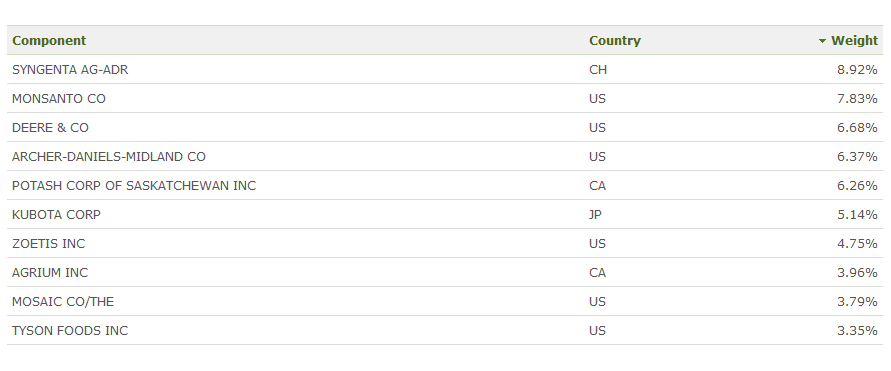
There are a few ways to take advantage of the strength we think is coming. One is, we can just keep it simple stupid and buy the ETF which tracks the entire index. But there are some individual names within the basket that also look interesting and offer much more liquidity. Here are the 10 biggest components by weighting:
I really like this space guys. I think $MOO sees a 15% jump in the near term, at least…..
Source:
Market Vectors Agribusiness Index Facts (Van Eck)
Copyright © AllStarCharts.com