


by Ben Carlson, A Wealth of Common Sense
There are a number of reasons cited for the fact that active fund managers have had a difficult time beating the markets over the years — higher costs, more trading activity, closet indexing, mis-timing the market, a shift to index funds and more highly-skilled investors, to name a few.
Here’s another theory to add to the list — the shrinkage effect. Not only are there more skilled players than ever looking to uncover sources of alpha, but there are also far fewer stocks to choose from, at least in U.S. markets.
The Wilshire 5000 Index is designed to track the performance of the entire U.S. stock market. It doesn’t cover over-the-counter, thinly-traded stocks or private companies, but it gets you about 98% of the way there for coverage of the entire U.S. stock market. According to a report from index provider Wilshire Associates, the number of stocks in this index have been on the decline for a number of years:
Developed in the summer of 1974, the yet to be named Wilshire 5000 Equity Index had just shy of 5,000 issues — thus the number 5,000 was made part of the name to convey the breadth of the index’s coverage. The Wilshire 5000 membership count has ranged from 3,069 on February 28,1971 to 7,562 on July 31, 1998. Since then, the count has steadily fallen to 3,776 on December 31, 2013 before climbing to 3,818 as of September 30, 2014. The last time the Wilshire 5000 had more than 5,000 companies was December 29, 2005.
Here’s the visualization of the shrinkage in the number of stocks in the market:
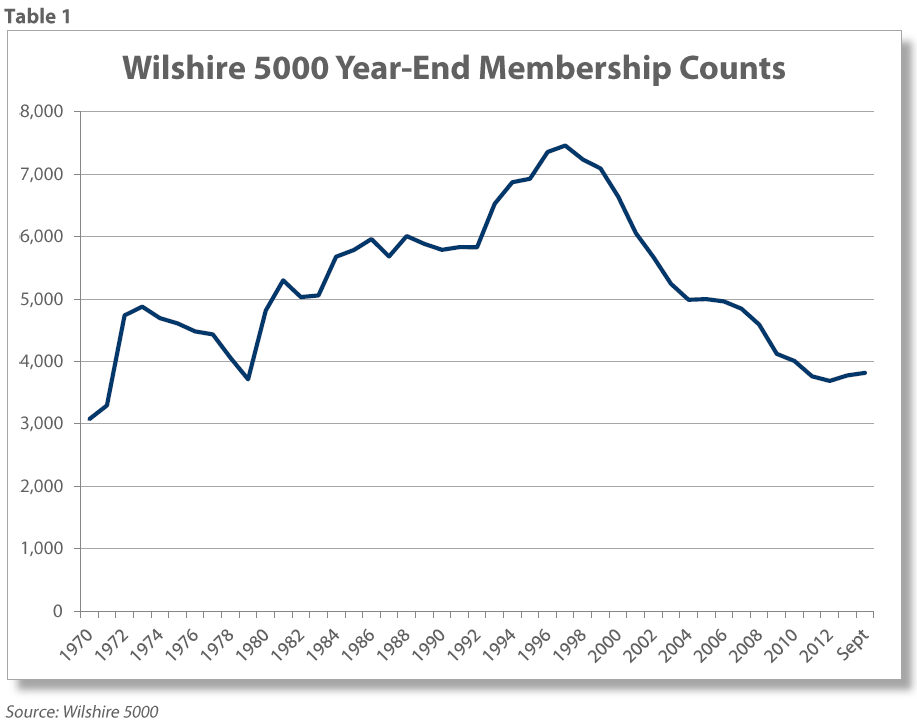 If you want to really boil down the reason for stock market moves over time it comes down to supply and demand. The remarkable thing about the 80s and 90s bull market is that the number of stocks in the index was rising the entire time. It wasn’t until right around the peak in the late-90s that the number of names started to fall dramatically. The total number of stocks has been cut in half since the high reached in 1998.
There are many reasons for this occurrence. There have been a number of mergers and acquisitions along with the fact that businesses do fail on a regular basis. But another reason is that private companies aren’t choosing to go public nearly as much as they once did in the past. From 1980 to 2000 there was an average of more than 300 companies every year that went public. Since then that number has dropped to an average of around 150 a year. Many blame regulations such as the Sarbanes-Oxley Act from 2002 for the reason more private companies are delaying going public for as long as they can. Two recessions in a decade and the short-term pressure to perform well on a quarterly basis haven’t helped either. You can see the effects on the IPO market in this graph from Renaissance Capital:

One of the interesting takeaways from the Wilshire study is that the decline in the number of public stocks hasn’t had a negative impact on the liquidity in the market. In fact, although investors have been complaining that this has been a low volume rally, by one measure there is much more liquidity in the market than in the past:
 This chart shows the turnover rates broken into market cap deciles at the end of 2003 versus the end of 2013. A huge positive for investors is that small cap stocks are now much more liquid to trade than they were in the past. This is great because theoretically this should lower the bid-ask spreads on the smaller stocks which were at one time very illiquid and hard to trade. That means lower market impact and trading costs in that portion of the market, another positive development for investors. This could be because of an increase in high frequency trading, but it’s a positive nonetheless.
The one thing that stands out to me from these numbers is that there are now more investors than ever out there chasing fewer and fewer stocks, but trading them more often. The logical conclusion is that this increase in activity and competition for good ideas has made it more difficult for portfolio managers to separate themselves from the pack and add value.
Sources:
Renaissance Capital’s 2014 US IPO Annual Review
Wilshire 5000: Myths and Misconceptions
Further Reading:
One Way to Beat the Market
The Cost of Doing Business For Active Mutual Funds
Subscribe to receive email updates and my quarterly newsletter by clicking here.
Follow me on Twitter: @awealthofcs
Copyright © A Wealth of Common Sense