
by Don Vialoux, EquityClock.com

**NEW** As part of the ongoing process to offer new and up-to-date information regarding seasonal and technical investing, we are adding a section to the daily reports that details the stocks that are entering their period of seasonal strength, based on average historical start dates. Stocks highlighted are for information purposes only and should not be considered as advice to purchase or to sell mentioned securities. As always, the use of technical and fundamental analysis is encouraged in order to fine tune entry and exit points to average seasonal trends.
Stocks Entering Period of Seasonal Strength Today:
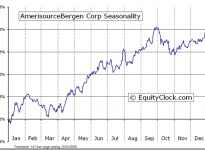
AmerisourceBergen Corp. (NYSE:ABC) Seasonal Chart
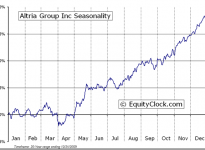
Altria Group, Inc. (NYSE:MO) Seasonal Chart
The Markets
Stocks advanced on Friday led by the Industrial sector as General Electric (GE) announced one of the largest buybacks in history. The company, which also announced plans to divest its GE Capital business, indicated that it could potentially return more than $90 billion to investors over the next three years, starting with a $50 billion stock buyback. Shares of General Electric closed higher by nearly 11%, hitting the highest level since early 2008, just prior to the negative impact that resulted from the financial crisis. Prior to Friday’s announcement, shares of GE had been stagnant since the start of 2014. The stock had resisted a number of times around $26.60 and a trend of underperformance versus the market was apparent. Resistance has now been overcome and outperformance has become immediately apparent, opening the door for a run towards the pre-recession high of $32.14. Expanding the range of data, it is clear that the consolidation in the stock over the past year has occurred around long-term trendline resistance that stemmed from the 2000 high, suggesting that the stock is breaking free of the grip of the so-called “lost decade” when stocks charted significant multi-year swings, but eventually realized stagnant returns over the period. The breakout occurs during the period of seasonal strength for General Electric, which began at the beginning of March, running through to the middle of May; the broad industrial sector follows a similar trend. The gap higher in shares of this multinational conglomerate is significant, suggesting further strength for the stock, the sector, and potentially the broad market as investors anticipate further corporate actions of significant cash balances among S&P 500 companies. According to FactSet, at the end of last year, S&P 500 ex-financial companies held $1.43 trillion in cash and short-term investments, a record high. This cash has the potential to fuel the ongoing strength in the equity market, possibly generating additional breakout returns by stocks in the large –cap index.

 Seasonal Chart")

With the news from GE helping to add to the gains in the S&P 500, the benchmark is showing signs of rebounding from the lower limit of the rising wedge pattern. The upper limit of the narrowing trading range currently sits around 2160, an ideal place to book some profits, if reached. Keep in mind, the rising wedge pattern typically results in a bearish outcome, suggesting that downside pressures are likely to follow a break below the lower limit of the pattern, presently around 2075. Earnings reports ahead are likely to determine the timing of the pending break. Reports start to flow in full force this week, potentially keeping investors on their toes. In addition to earnings this week, the income tax deadline in the US is this Wednesday, after which equities have a tendency to strengthen. Over the past 20 years, the S&P 500 Index has gained an average of 2.08% between April 15th (tax deadline day) and April 30th. The frequency of gains is 75%. As the burden of paying income taxes by the deadline is alleviated and income tax returns are received, money tends to flow back into the equity market, driving prices higher.

With mid-April upon us, two important shifts occur in the seasonal sector rotation strategy in the US. The first is the end of the period of strength for financials and the second is the beginning of seasonal strength for technology. Financials typically gain between January and mid-April, benefitting from strength related to first quarter guidance. Although the trade in the financial sector has been profitable, the relative performance versus the S&P 500 Index has failed to live up to seasonal norms. Performance of the S&P 500 Financial sector since January has been on par with the broad market. Around the time that some of the first earnings reports for financial companies are released, the sector enters a period of underperformance that runs through to mid-July. JP Morgan, Wells Fargo, Bank of America, Citigroup, and Goldman Sachs are just some of the financial companies reporting this week, providing the catalyst to influence the sector, one way or the other. And where financials leave off, technology takes over, gaining between mid-April and mid-July. Both sectors have shown relative weakness versus the market over the past couple of months, but if seasonal tendencies materialize as per the norm, the technology sector should be expected to outpace the market return over the months ahead.


Sentiment on Friday, as gauged by the put-call ratio, ended bullish at 0.85.

Sectors and Industries entering their period of seasonal strength:

^NDX Relative to the S&P 500 

Seasonal charts of companies reporting earnings today:


S&P 500 Index


TSE Composite


Horizons Seasonal Rotation ETF (TSX:HAC)
- Closing Market Value: $16.19 (up 0.12%)
- Closing NAV/Unit: $16.19 (up 0.32%)
Performance*
| 2015 Year-to-Date | Since Inception (Nov 19, 2009) | |
| HAC.TO | 7.01% | 61.9% |
* performance calculated on Closing NAV/Unit as provided by custodian
Click Here to learn more about the proprietary, seasonal rotation investment strategy developed by research analysts Don Vialoux, Brooke Thackray, and Jon Vialoux.

| Sponsored By... |
|
|