ENERGY SECTOR OUTLOOK: WHAT WE ARE WATCHING
by Burt White, Chief Investment Officer, LPL Financial
Here are some of the key factors we are watching to assess the potential upside opportunity in the energy sector:
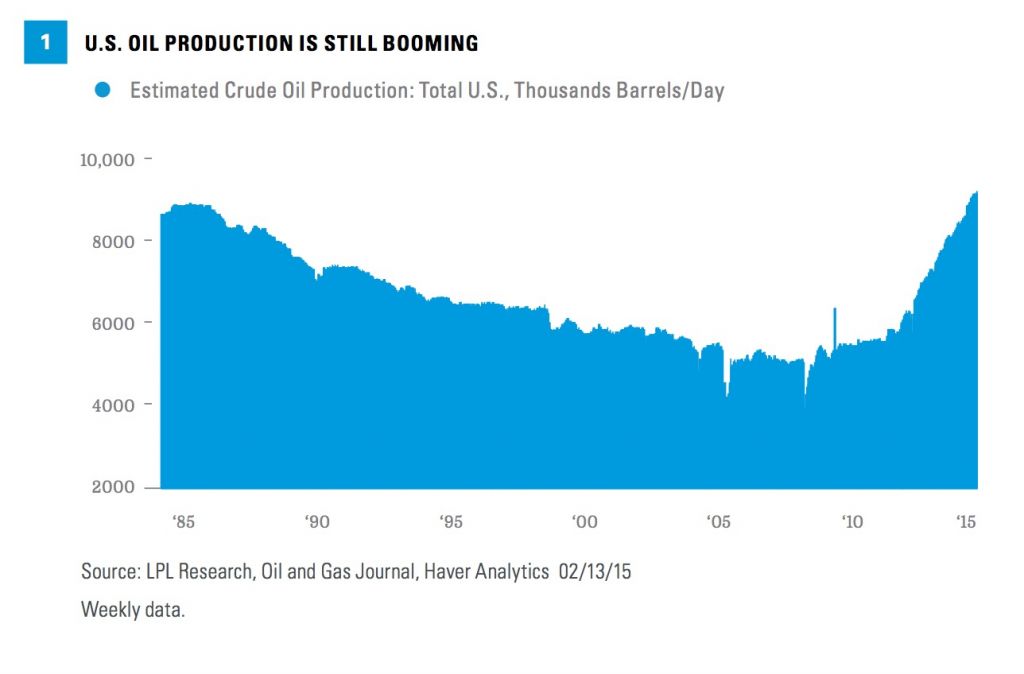
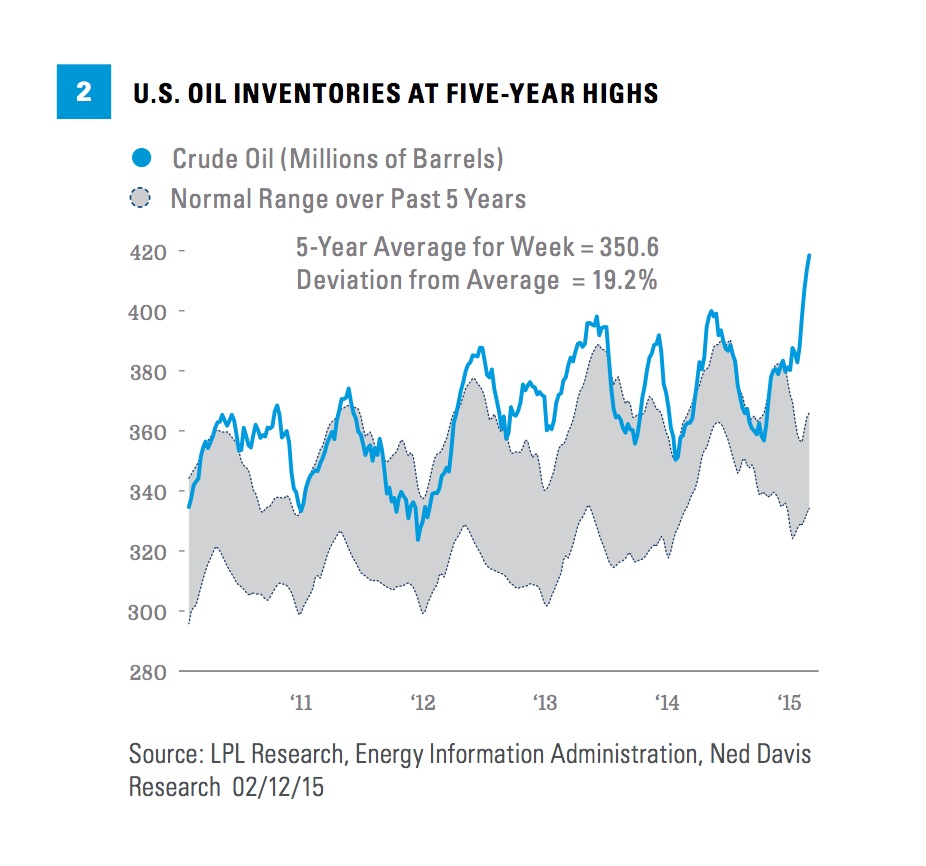
Supply. The massive drop in domestic oil prices (more than 50% since June 20, 2014) has been almost entirely supply driven, with modest contribution from slowing global growth. Thanks to booming U.S. oil production [Figure 1], inventories are not only well above the five-year range for this time of year [Figure 2, page 2], but they are near their highest levels on record. According to the International Energy Agency (IEA), the global oil market is currently about 800,000 barrels per day oversupplied (for perspective, the global oil market is roughly 94 million barrels per day). We do not expect a rapid supply response from producers given low marginal costs of continuing the most cost-efficient production, which means that lower prices may be required to balance the market. We would expect the bottom in oil to be put in once the market sees actual and meaningful supply reductions, which has not happened as of yet and could take several more months.
Future production plans. While plans for future production do not impact supply today, the oil market is forward looking and has been reacting to news that affects future production. Major oil producers such as BP, Chevron, and ConocoPhillips have cut capital spending plans by 10% to 15% in response to lower prices. Rig counts have fallen more than 30% from their recent peak. The drop in drilling permits has been similar throughout key oil-producing regions in the United States. But future capital spending plans do not help balance the oil market in the near term. So while we are watching these factors, the continued healthy pace of U.S. production even in the face of these cutbacks suggests the market may need lower prices, or more time, to balance.
OPEC. The latest leg down in oil was driven by OPEC’s (Saudi Arabia driven) decision to hold its production target unchanged on November 27, 2014, despite the drop in oil prices that had already occurred from the summer peak of over $100 per barrel down to the high $70s. OPEC has still not responded despite an additional 30% decline since late November into the low $50s. Given Saudi Arabia’s willingness to sacrifice revenue for market share and the cartel’s declining influence, we are not counting on OPEC to lift prices.
Geopolitical risk. Geopolitics are always a wildcard and worth watching, especially considering the financial stresses on big oil-producing nations such as Russia, Iran, and Venezuela, and the threat of terrorism throughout the Middle East. This risk to the global oil market is mitigated some by strong U.S. production, however, so while geopolitics could potentially help oil through its bottoming process, sustained gains will probably require more fundamental support.
Earnings estimates. Energy sector earnings estimates for 2015 have been reduced by 60% since September 30, 2014, based on Thomson Reuters–tracked estimates, and are calling for a 53% year-over-year drop. Based on historical data during prior oil downturns, the bulk of the reduction may have already occurred, which could signal a turn in sector performance is approaching. For comparison, S&P 500 energy sector earnings dropped by about 50% during the oil downturn in the early 2000s (October 2001 through March 2003) and by about 70% during the 2008–2009 financial crisis (admittedly not a great comparison) and during the mid-1980s (March 1984 through December 1987, based on Ned Davis Research earnings estimates). The mid-1980s offer a good comparison because the U.S. oil production boom came during the middle of an economic expansion.
Valuations. Energy sector valuations present a mixed picture. Based on significantly reduced earnings estimates, the sector looks expensive at a forward price-to-earnings ratio (PE) over 25 times. But potentially higher oil prices and further cost cuts from producers as they continue to adjust to lower prices may make those earnings estimates overly pessimistic, resulting in more attractive valuations longer term. Looking at another measure, the sector is attractively valued relative to its history on price-to-book value (market capitalization versus assets minus liabilities). While the picture is mixed, we would say that the potential upside to oil prices and consensus earnings forecasts, and the low price-to-book ratio, make energy sector valuations intriguing but not compelling.
U.S. dollar. As we noted in our January 26, 2015, Weekly Market Commentary, “No Deflating the Dollar,” the U.S. dollar and oil prices have exhibited a fairly strong inverse correlation in recent years (in other words, a strong dollar has tended to be a drag on oil prices, and vice versa). As a result, we are watching the U.S. dollar to help determine when a turn in oil prices may be sustained.
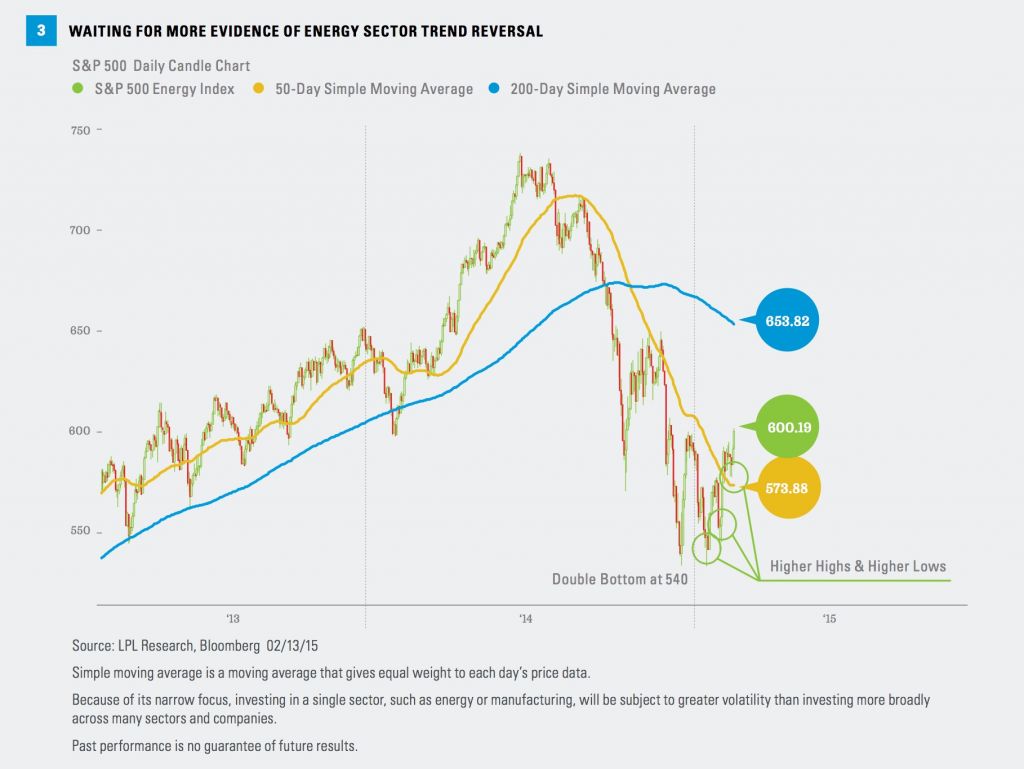
Technical trends. The energy sector, represented by the S&P 500 GICS Energy Sector Index, may be close to finding a bottom from a technical perspective, but we would still like to see additional confirmation. After experiencing a bearish trend from July 2014 through January 2015, the chart patterns are now exhibiting characteristics suggesting a potential trend reversal. But we have not yet seen a series of higher highs and higher lows to signal a bullish trend. Looking at the sector’s daily candle chart [Figure 3], a double bottom price pattern was established in December and January, followed by a series of higher highs and higher lows, indicating the early stages of a bottoming process. More recently, the energy sector’s price has closed back above its 50-day simple moving average, which, if it can be sustained, increases the likelihood of a trend reversal. Further confirmation would come if the sector index moved back above its 200-day simple moving average. Finally, an upward-pointing 200-day simple moving average trend line would indicate a bullish long-term trend. The risk technically is that the sector index breaks below double bottom support, which would increase the likelihood of a continuation of the bearish trend.
HELP WITH TIMING FROM HISTORY?
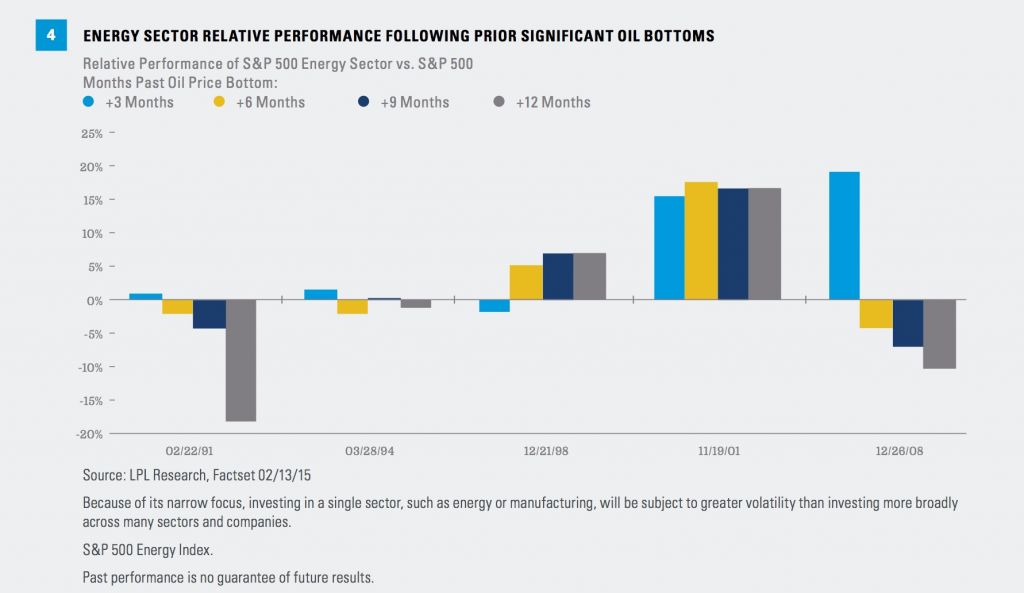
To help with timing a potential upgrade to our energy sector view, we believe it is instructive to look at sector relative performance during similar bear markets in oil. To do that, we can look at how the energy sector performed relative to the S&P 500 after significant oil price bottoms over the past 25 years. As you can see in Figure 4, the energy sector tends to outperform over the subsequent three months following an oil bottom, but the performance record beyond that short-term period is mixed at best. (Note that Ned Davis’s proxy for the energy sector, not shown in Figure 4, performed well shortly after the 1986 oil price bottom but was mixed intermediate term. The S&P 500 sectors were created in 1990.) This analysis, with the disclaimer that these periods were all very different economically, does suggest a trading opportunity in the near term but not necessarily a great long-term hold.
HELP WITH TIMING FROM HISTORY?
Although energy valuations are intriguing and we have seen early evidence of a trend reversal technically, the fundamentals of the oil market tell us that the commodity may have further downside in the short term and that we should be patient with a potential sector upgrade. Bottom line, while we expect to try to take advantage of opportunities in the sector in short order and will continue to watch these key factors closely, we are not convinced that it now presents a great entry point. We continue to recommend the consumer discretionary sector, where suitable, as a way to play low energy prices while waiting for more evidence that the energy sector has bottomed.
Read/Download the complete report below:
Energy Outlook: Weekly Market Commentary 02.17.15(1)
**********
IMPORTANT DISCLOSURES
The opinions voiced in this material are for general information only and are not intended to provide specific advice or recommendations for any individual. To determine which investment(s) may be appropriate for you, consult your financial advisor prior to investing. All performance referenced is historical and is no guarantee of future results.
All indexes are unmanaged and cannot be invested into directly.
The economic forecasts set forth in the presentation may not develop as predicted and there can be no guarantee that strategies promoted will be successful.
Investing in stock includes numerous specific risks including: the fluctuation of dividend, loss of principal, and potential liquidity of the investment in a falling market.
Because of its narrow focus, investing in a single sector, such as energy or manufacturing, will be subject to greater volatility than investing more broadly across many sectors and companies.
All investing involves risk including loss of principal.
Because of its narrow focus, specialty sector investing, such as healthcare, financials, or energy, will be subject to greater volatility than investing more broadly across many sectors and companies.
Commodity-linked investments may be more volatile and less liquid than the underlying instruments or measures, and their value may be affected by the performance of the overall commodities baskets as well as weather, geopolitical events, and regulatory developments.
Technical analysis is a methodology for evaluating securities based on statistics generated by market activity, such as past prices, volume and momentum. Technical analysts do not attempt to measure a security’s intrinsic value, but instead use charts and other tools to identify patterns and trends. Technical analysis carries inherent risk, chief amongst which is that past performance is not indicative of future results.
INDEX DESCRIPTIONS
The Standard & Poor’s 500 Index is a capitalization-weighted index of 500 stocks designed to measure performance of the broad domestic economy through changes in the aggregate market value of 500 stocks representing all major industries.
The S&P 500 Energy Index comprises those companies included in the S&P 500 that are classified as members of the GICS energy sector.
DEFINITIONS
Double bottom: A chart pattern in technical analysis where the price falls to a particular level twice, typically over a relatively short period of time, creating a “W-shaped” price pattern that we believe may suggest support for that particular investment at or near that particular price level.
Candlestick chart: A candlestick chart is a way of representing the open, close, high, and low for each period in a price chart. The range from the opening price to the closing price is represented by a rectangle, called the real body; the high and low are represented by lines that extend from the body to the high and the low, called wicks.
Technical analysis: The methodology for forecasting the direction of prices through the study of past market data — primarily price and volume.
Not FDIC or NCUA/NCUSIF Insured | No Bank or Credit Union Guarantee | May Lose Value | Not Guaranteed by Any Government Agency | Not a Bank/Credit Union Deposit
RES 4989 0215 | Tracking #1-355067 (Exp. 02/16)
Copyright © LPL Financial