


For this weeks SIA Equity Leaders Weekly, we are going to revisit the broad U.S. and Canadian Equity markets. With the recent market correction over the last month, it is important to take a look closer into this context in light of past corrections for our outlook moving forward for each equity index.
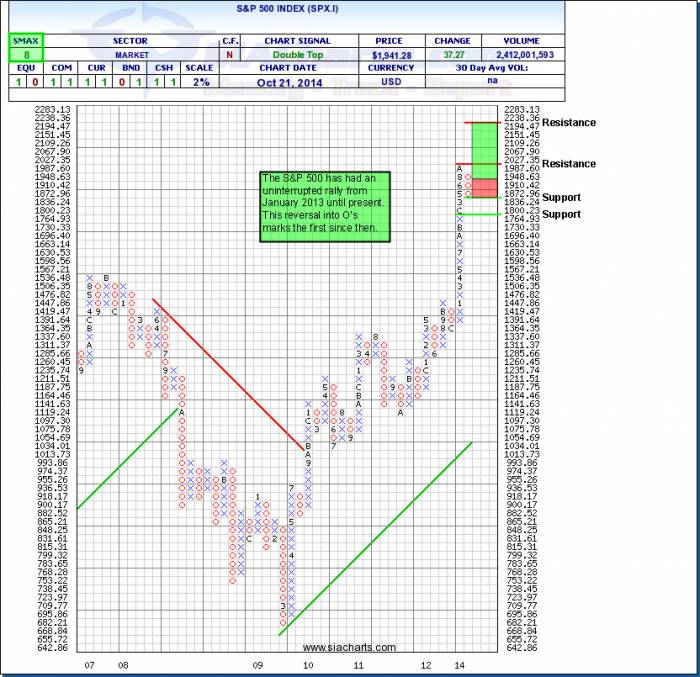
S&P 500 Index (SPX.I)
The S&P 500 (SPX.I) has been in a row of X's since January of 2013 until this month. This marked the first reversal into a column of O's on a 2% scale Point and Figure chart in over 22 months. This uninterrupted rally has seen the S&P 500 move to new all-time highs and cross over the 2000 level. This resistance level at 2027.35 has been material both from a technical and psychological level and caused the first reversal down to the support level at 1836.24. Further support can be found at 1764.93.
After this reversal, the S&P 500 Index is still showing a near-term strength SMAX score of 8 out of 10. This near-term positive outlook could see the SPX.I move through to new all-time highs. The next resistance level and possible price objective could be found at 2238 which is depicted on the chart with a green and red box showing the potential positive outlook in the green and the red box showing the possible drawback potential to the first support level. When looking at this reversal in the context of the S&P's historical movements, it is still considered normal price movement in the context of a long-term Bullish move.
Click on Image to Enlarge
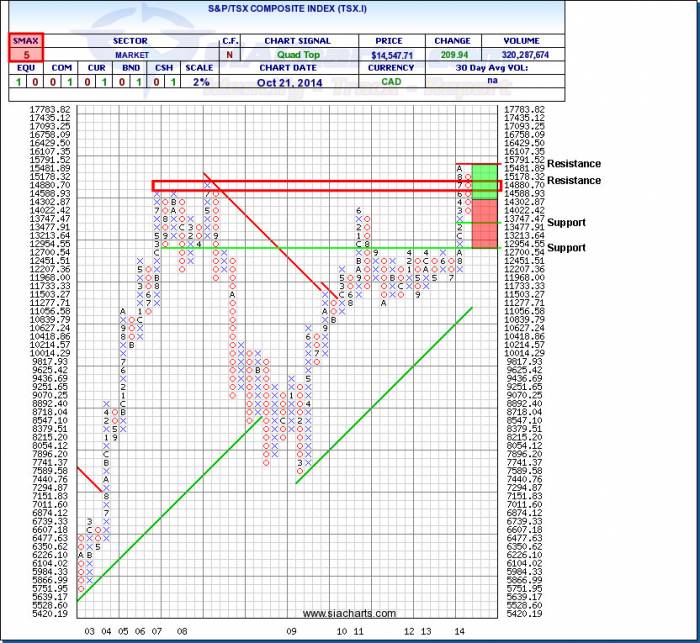
S&P/TSX Composite Index (TSX.I)
Unlike the U.S. Equity markets we just looked at, the TSX Composite Index (TSX.I) had a larger drawdown of a ~10% reversal. The TSX.I did not hold at its support level like the U.S. Equity market did. There is still further support at 13747 and key support at the 12,700 level. To the upside, resistance can now be found around prior highs from 2007 and 2008 around 15000. Further resistance is at the high from this year at 15791.
The SMAX near-term strength score is a 5 out of 10 showing some short-term weakness against the other asset classes. This outlook is depicted by the green/red price objective boxes showing the upward potential if it moves back to challenge the all-time highs or if weakness continues to key support levels. This reversal is still in the context of a longer Bullish move, but gives more red flags from a charting standpoint than the U.S. Equity pullback does.
Over the past 10 years, there have been 15 declines of greater than 5% on the TSX. However, of those 15, only 2 were significant which led to bear markets in 2008 and 2011. In hindsight, we can see these corrections were nothing more than “noise” as the markets resumed its uptrend. However, during each correction it is not uncommon for many investors to get scared and lose their patience with their advisor, their investments, and their systems. They mistakenly believe that successful investing requires the ability to avoid all market downturns. In our view, successful investing is the ability to avoid bear markets while ignoring short term corrections. The purpose of market corrections is to reset sentiment so that the next leg in the uptrend can continue. They are vital to a healthy long term uptrend. The key is to be able to distinguish between corrections and bear markets. SIA uses Relative Strength analysis to accomplish this distinction with an objective perspective on the markets to help give you a powerful tool to navigate difficult times.
Click on Image to Enlarge
SIACharts.com specifically represents that it does not give investment advice or advocate the purchase or sale of any security or investment. None of the information contained in this website or document constitutes an offer to sell or the solicitation of an offer to buy any security or other investment or an offer to provide investment services of any kind. Neither SIACharts.com (FundCharts Inc.) nor its third party content providers shall be liable for any errors, inaccuracies or delays in content, or for any actions taken in reliance thereon.
Copyright © SIACharts.com